4 minute read
Looking to Improve Store Efficiency? Just Follow the Rainbow


Does this scenario sound familiar? You are a small team of retail labor engineers, or maybe even just one person—yet you’re responsible for managing labor allocation across dozens, hundreds or thousands of stores. It can seem like quite an impossible task. How can you easily determine whether or not your labor model is working well across the chain, or identify which stores are experiencing significant operational issues?
An earned hours program is the right place to start. The premise is cut and dried: Earn time for the things you do, and none for the things you don’t. Simply put, an earned hours model is a set of expectations regarding how you want your business to run, which creates a baseline for the true “earned” hours a store should require for optimal operations. The model sets the foundation for the next step, where the rubber meets the road: Making those expectations happen in a real store environment.
With limited resources, no labor management team can personally visit every store. Instead, the earned model should serve as the guide delivering valuable performance insight. Variation from earned hours can provide important clues prompting you to evaluate both labor model accuracy as well as how effectively the store is working to achieve 100 percent earned hours performance. The path to improvement is often some combination of labor model revisions, store-level performance management resolution, or both. Let’s look at an example:
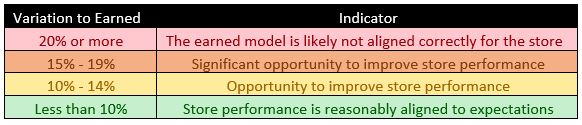
The table above represents buckets for how greatly a store’s actual hours vary from the earned hours. A small variance represents high likelihood that the earned model is aligned well, and the store is performing relatively well to expectations. The further the variance increases, the more likely it is that either the earned model is not applied correctly to the store, or the store is not following proper expectations. The ranges of each bucket can be tailored for what makes sense in your organization. Applying colors to each bucket provides an easy-to-follow “Rainbow” of store performance.
To illustrate this concept, let’s apply the Rainbow to a theoretical example set of 30 stores with the following hypothetical data:
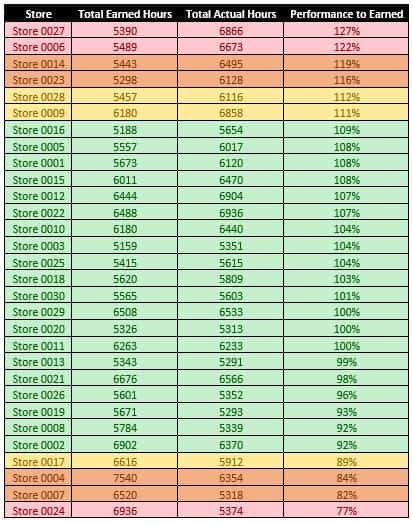
“Performance to Earned” represents each store’s actual hours compared to what was earned. A store scoring 100 percent means the store used exactly the number of hours that it earned. Stores performing under 100 percent used more hours than earned, and vice versa for performance over 100 percent. Using earned hours helps to identify potential operational issues and any tasks that are accounting for excess time. This visibility enables root cause analysis and performance management discussions with store leaders, and the ability to develop informed, time-based action plans to close the gap toward 100 percent earned hours performance.
In our hypothetical example, we can quickly see that 20 of the stores performed within +/- 10 percent of what they earned. When working with the Rainbow, it is always most effective to work from the outside inward, as these are the stores with the most significant issues. As such, we’ll focus attention on the stores outside the green zone.
Under-performing stores (performance 90 percent or lower)
Red zone. Store 24 is in the red zone. It’s likely that the earned model is not accounting for all of the processes or offerings applicable to the store. Address this scenario by setting up a plan to identify the considerations that are not being applied to the store.
Orange zone. Stores 4 and 7 are in the orange zone, indicating they are significantly under-performing. This may be because they are performing activities they shouldn’t be, staffing coverage positions that do not align with expectations, or experiencing significant issues with associate turnover and performance. It is also possible that expectations in the earned model are not aligned appropriately for these stores.
Yellow zone. Store 17 is in the yellow zone, slightly under-performing. It’s unlikely that the earned model is missing any significant processes or offerings; rather, the issues are probably operational.
Over-performing stores (performance 110 percent or more)
Red zone. Stores 27 and 6 are in the red zone. It’s likely the earned model is crediting time for processes or offerings that do not apply. Set a plan to identify what is incorrectly being applied to the stores.
Orange zone. Stores 14 and 23 are in the orange zone, indicating they are significantly over-performing. This may be because the stores are not performing processes they should be or are not fulfilling proper expectations. It’s also possible that expectations in the earned model are not aligned appropriately for these stores.
Yellow zone. Stores 28 and 9 are in the yellow zone, slightly over-performing. Over-performing stores are good, but it’s unlikely that these stores are truly able to perform this well versus the earned model. Take a closer look as they may not be following all expectations in the earned model.
Improving the ends of the rainbow
By starting from the outside and working inward, a team with limited resources can identify the improvement areas that will have the most impact, and then methodically work toward the necessary changes with store leaders to ensure a reasonable alignment of budget and store performance across the chain.
First correct any potential model misalignment, then look to common root cause issues behind a store exceeding earned hours. These can range from excessive full-time employees, low scheduling flexibility, poor work methods, and disorganized work environments, to store service expectations vs. company-defined service expectations, poor forecasting, front-loading schedules, and poor department handoffs, communication and training.
When you know what’s not working, you can plan accordingly. District managers, store managers, corporate specialists and labor analysts are all resources who can be organized to help identify and address the opportunities for improvement in outlying stores.
Once the ends of the Rainbow yield better results, your labor team can focus on long-term performance improvement of stores in the green zone.
So if you are a labor engineer struggling to decide where to begin, just follow the Rainbow!