4 minute read
Specialty Retail: The Invisible Traffic Is the Visible Issue


Welcome to part two of this specialty retail blog series. We are exploring new options for workforce management (WFM) and store execution management (SEM) systems to address challenges unique to specialty retail. In part one, we outlined four key issues inherent in most specialty retail environments:
- The challenges posed by conversion rates.
- Building better labor standards using utilization and customer journey data.
- Task-level work planning and execution with a highly cross-utilized store staff.
- Opportunities to move from top-down to bottom-up (work content-based) labor management.
Given that most WFM providers do not deal with these issues, but instead rely on approaches that serve grocery and big box formats, there are substantial opportunities for specialty retailers who are open to better solutions. In our last blog post, we described the negative financial, cultural and marketing impacts on specialty retailers that come from incomplete vendor approaches and deal with new competitive pressures, especially due to multichannel marketing.
The Conversion Rate Challenge
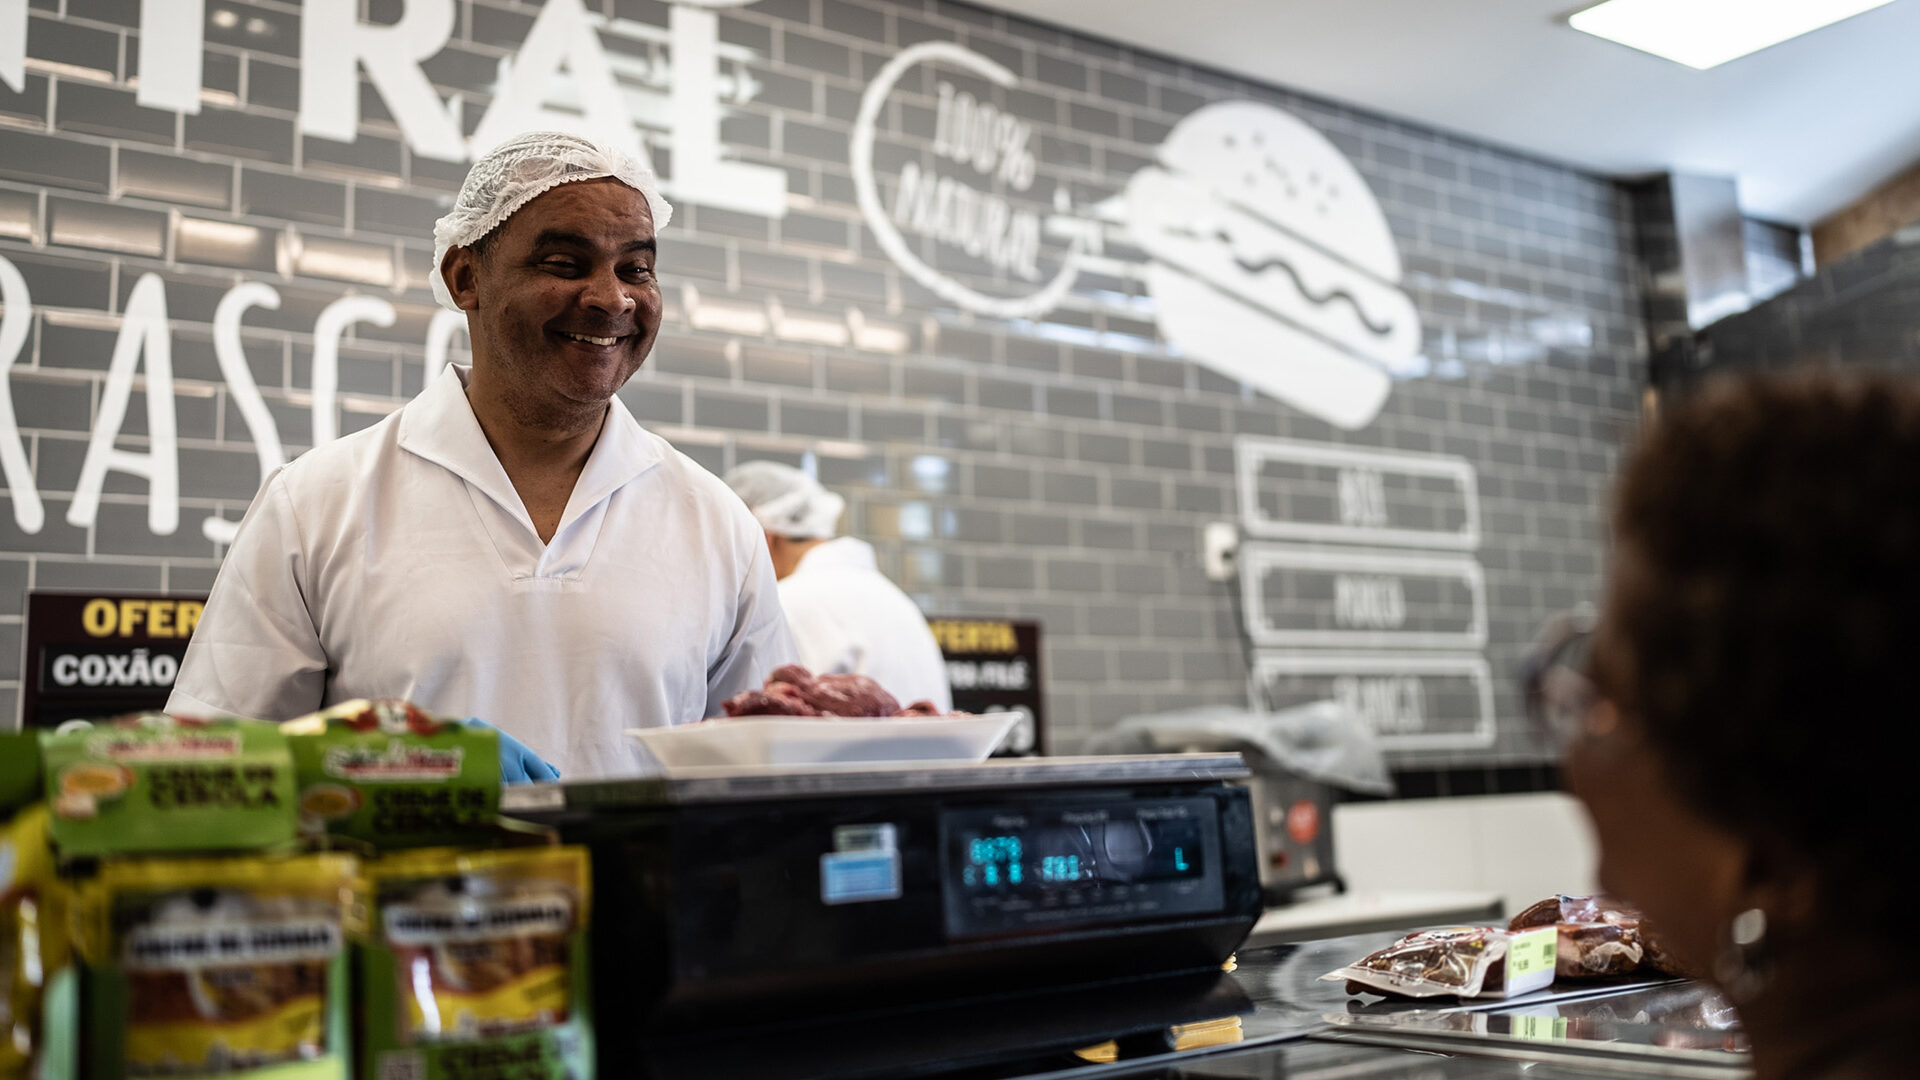
What is conversion and why is it an issue for specialty retailers? Let us answer with a comparison. In grocery retail, store planners can assume a virtual conversion rate of 100 percent. This means almost every shopper who enters the store and requires service will exit with some type of purchase. Converted shoppers (i.e., customers and items) become a part of the point-of-sale (POS) record by time of transaction. The POS record delineates the items for which the customer required service—some self-service items demanded restock and replenishment, while others demanded service interaction at a production counter (e.g., the deli).
Point-of-sale data yields almost a perfect historical record for forecasting purposes. As an example, if 100 shoppers enter the store and buy something that indicates a 100 percent conversion rate. The item and customer movement in the POS transactional data become volume drivers. Apply these volumes to your labor standards, and you can easily forecast your workload for production or replenishment tasks. The workload is clear to see and is captured by the data.
The Specialty Retail Difference
This is not how it works for retailers in apparel, cosmetics, electronics, vitamins or many other specialty retail stores. Many never become destination sellers; at least part of their incoming customer traffic varies from what grocers are accustomed to. Special customer behaviors come into play. Some customers window shop by trying on or trying out items before buying, sometimes on multiple occasions. They may make a purchase eventually, but not always. Another phenomenon retailers deal with is showrooming: customers who physically interact with products in-store and then buy them at the cheapest price online. Window-shopping, showrooming and pre-shopping, which consists of customers who wait for promotions, are a regular part of the specialty retailer’s operations.
The Impact of Invisible Traffic
Conclusively, the conversion factor for a specialty retail business can be far less than 100 percent. Conversion varied between 7 and 25 percent in two studies following specialty retail trends1, 2. That rate can vary significantly by hour of day, day of week, time of month, season of year and promotion of choice. Evidence also shows that, when traffic exceeds the average, there is a fading return between customers and conversion1, 2. Thus, the real traffic requiring service on a variety of tasks cannot be determined by POS activity alone, but forecasts must take into account real store traffic and its accompanying activities. Such activities might include refolding, repackaging or recovery, as well as zoning tasks on the sales floor or in fitting rooms.
Additionally, conversion is directly impacted by staffing as poor staffing can cause drops in conversion rate. One study showed that as a result of understaffing during high traffic times, conversion dropped by 1.95 percent during a three-hour peak period1. So, if specialty retailers are not forecasting true workload volumes, and thus staffing inadequately, they are inadvertently driving down their conversion rate. It is a reciprocal relationship; specialty retailers need to better understand conversion to properly staff stores to keep up conversion.
Finally, research alludes to the possibility that an uptick in conversion rates is positively correlated with higher customer loyalty2. This was confirmed by university business professors Perdikaki, Kesavan and Swaminathan2, who found that as conversion goes up, so does an increase in future traffic growth. This makes the metric highly impactful for specialty retailers; it creates long-term investment into their businesses.
Making the Hidden Workload Visible
In order to support the optimization strategies that have saved grocers and big box operators thousands of hours and millions of dollars, while also enabling them to better execute their sales-building and service strategies, specialty retailers must accurately quantify their workload including the hidden elements.
Addressing this miss involves specific challenges in data capture, standards modeling, predictive forecasting and store staffing. By its very nature, this is a bigger forecasting challenge than every grocer encounters. More complex data and/or standards are needed to correctly forecast workloads and create accurate revenue forecasts along with weekly, daily and hourly schedule requirements.
Current technology is more capable than ever to create work content-based forecasts that include the unconverted customers and their affiliated workload. If your vendor understands your business, options are available.
With better forecasts and schedules, it is possible to close the service optimization gap in specialty retail, once you stop expecting it to follow the grocery store model. Options include various devices to sense and quantify real customer traffic beyond the POS activity journal. Another approach is to sample and model the hidden workflow through engineered studies on associate utilization or in data capture through customer journey studies. This is our upcoming topic for next week’s blog post. Please join us for it.
References
- Mani, V., Kesavan, S., & Swaminathan, J. M. (2015). Estimating the impact of understaffing on sales and profitability in retail stores. Production and Operations Management, 24(2), 201-218. doi: 10.1111/poms.12237
- Perdikaki, O., Kesavan, S., Swaminathan, J. M. (2012). Effect of traffic on sales and conversion rates of retail stores. Manufacturing & Service Operations Management, 14(1), 145-162. doi: 10.1287/msom.1110.0356