4 minute read
Carving it Up: Leverage Data From Your Perimeter Production Departments to Optimize Scheduling


Rachael Bilan, Customer Program Manager
Olufemi Olowu, Implementation Specialist
Service Scheduling. This term has been applied and used primarily for the checkout department for years. It refers to use of granular time-of-day data, typically at the 15-minute increment, to drive forecasted labor demand. The checkout department processes a large volume of customers and items, thereby becoming the essential drivers for labor. For those organizations that have been able to study and harness detailed historical information about these two metrics, there have been numerous improvements in technology, configurations and processes that enhance the demand forecasting processes, thereby improving scheduling and profitability. In checkout departments, the primary data source used to gather this information are registers that can capture the pertinent data, down to the 15-minute increment in most cases. Using this data source, organizations can derive historical trends, seasonality, and either micro or macro changes in business to be able to accurately forecast future needs to outlay labor resources accurately.
So, what about the perimeter areas, like delis, bakeries and meat service counters? Can we harness the same benefits of 15-minute data in those production departments as well? Definitely! Data from satellite registers in these departments could provide insight into when items have been purchased from each production area, but that data is not enough on its own, nor are registers always present in these locations. Part of the required customer processing entails preparing product for the consumer to purchase. The timing of this labor does not correspond to when the customer checks out at a register. It necessarily occurs well before the customer even reaches the checkout line.
Scale data plus register data
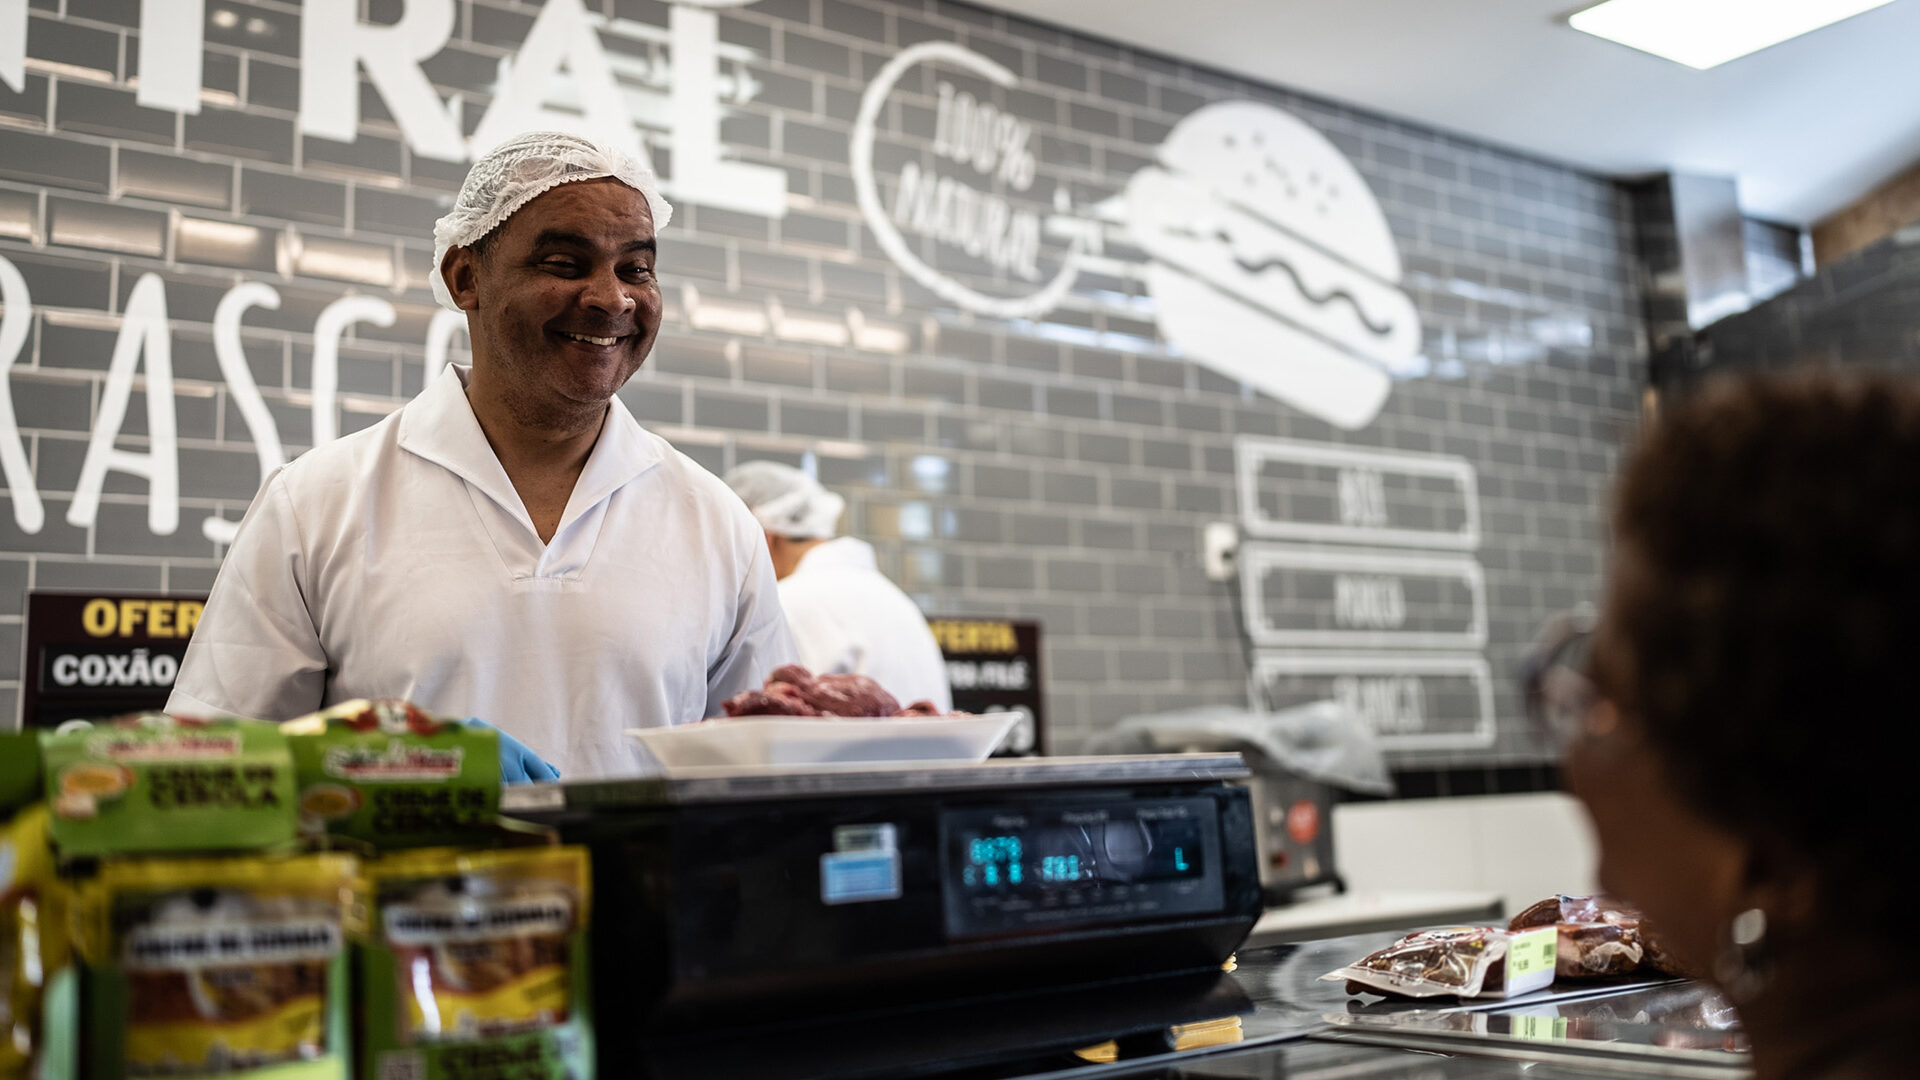
Envision a deli service counter, one that sells and cuts meat, cheese, premade salads etc. We are particularly interested in understanding the labor that occurs exactly when a customer reaches the deli counter. This includes processes like greeting the customer; slicing meat or cheese; weighing, and packaging and labeling the product. It is common for delis to use a minimum coverage labor model in order to forecast and schedule required labor, simply scheduling the base number of employees at any given time. This can be hit-or-miss in terms of providing great customer service, especially during time periods of increased business, negatively impacting queuing as customers must wait for either their orders to be processed or those in line before them.
What is needed is a way to understand exactly when customers are reaching the counter and how much labor is required to service that customer and use data to find the peaks and valleys of the business. Enter scale data. As items are processed in a deli, they must be weighed at a scale, priced and labeled for sale. This weighing happens exactly when the customer is requesting the item. By utilizing data processed through the deli scale, organizations can see exactly how much of each PLU was processed at a given timeframe throughout the day. Utilizing this scale data to drive labor forecasts and improve scheduling pays huge dividends in terms of efficiency, productivity and customer service. In the next section we will see the potential of what can be done when using detailed 15-minute scale data to forecast and schedule hours.
Benefits of this approach
Pictured below are comparisons between a traditional demand generation, using an approach that considers only daily-level data from one source, versus the application of a proven service solution model that utilizes 15-minute incremental data. The blue line represents the original forecasted labor demand, and the green line represents the true labor demand only known with certainty after the day has completed. Layered over these lines are highlights showing where we scheduled more than we needed (yellow) or less than we needed (red). See the graph depicting the traditional approach:
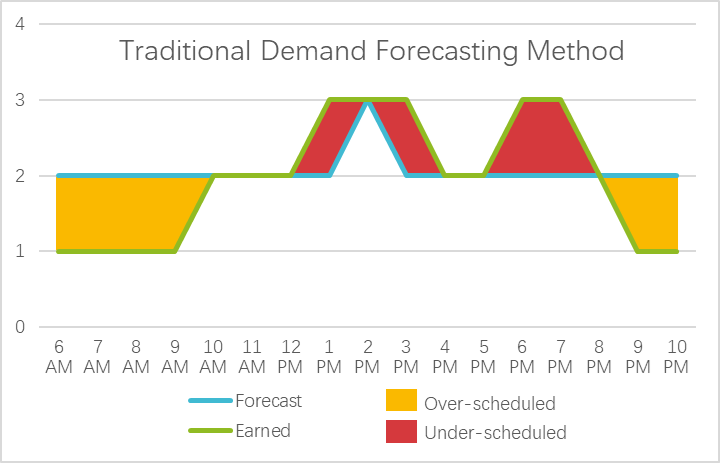
Here the main objective is to have minimal coverage throughout the day to cover the hours of operation. The forecast is mostly flat, with only one spike in the middle of the day, where we’ve guessed the peak will be. As you can see, there is a high degree of inefficiency as the day progresses. Queuing during peak times in business is unavoidable, causing a definite lack in both customer service and, as a result, loss in revenue. In times of low customer traffic, the service counter is over-scheduled, and employees are likely not fully utilized.
Conversely, take a look at the second solution below that uses detailed data derived from service counter scales.
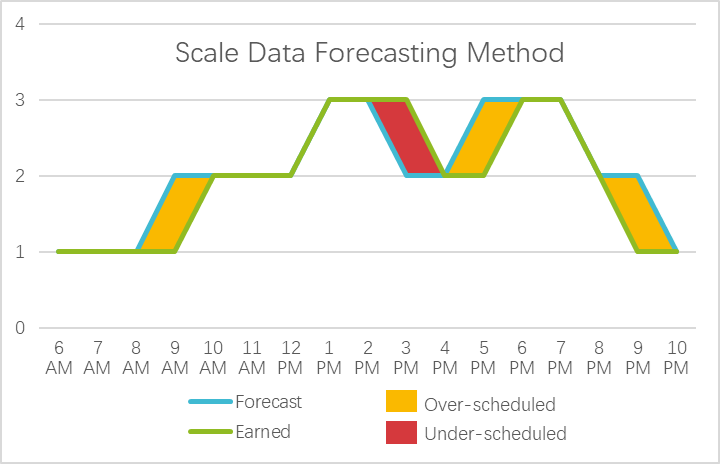
The original forecasted demand is much closer to the true demand curve, resulting in less inaccuracy and better use of hours, not to mention enhanced customer service during the busiest times of the day.
Conclusion
There are definite opportunities to forecast labor demand accurately and efficiently in perimeter production departments down to the 15-minute increment, especially those with customer service counters. When one looks at perishable departments, such as meat and deli, and the rising costs of perishable goods sold in those departments, it is imperative that the labor is controlled and scheduled in order to maximize both customer service goals and profitability.
Businesses need to use all information available to be able to pinpoint, with more accuracy, the actual needs of labor to take care of all aspects of the business, rather than simply covering the hours the service counter is open. As has been seen in the checkout departments, forecasting and scheduling to this level can pay dividends in enhanced customer service, while reducing labor costs. Investment in harnessing detailed time-of-day data that can accurately capture and fuse multiple data sources, should not be ignored. It will help blaze a path to improved longevity in the competitive environments of today’s ever-changing business landscape.