

Welcome to a follow-up blog post on how to leverage an earned hours model to improve store performance. In part one, we discussed how an earned hours model identifies store opportunity and techniques for categorizing stores into various opportunity buckets. This insight and structure enable a labor team to effectively prioritize its time and resources while dramatically helping to improve operations. In this second installment, we’ll focus on what comes next. That is, how do we actually address the gap between what a store is earning and its actual performance?
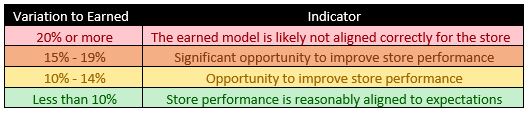
Last time we examined a hypothetical example of performance across a set of stores to bring the earned hours labor model to life. We applied a “Rainbow” methodology, using colors to represent varying performance levels and associated indicators as shown below.
Following the same Rainbow methodology from that illustration, let’s focus on the store in our hypothetical with the most improvement opportunity: Store 0027.
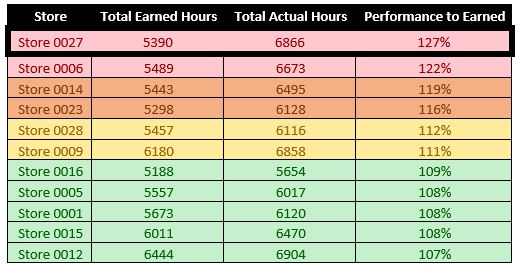
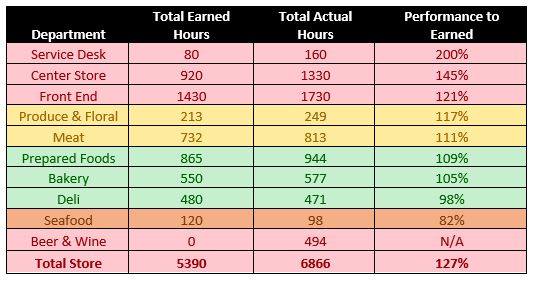
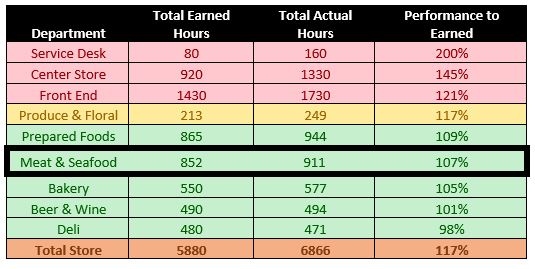
For the purposes of this example, we’ll assume Store 0027 is a typical grocery retailer, but the methodology can be applied to any retail environment. The model is telling us that this store is currently using 27 percent more hours than it is earning. It is unlikely that the store is using the 27 percent more hours uniformly across all of its operations, so the next logical step is to try to narrow down which parts of the operation the issues reside. To do this, let’s apply our Rainbow methodology at a department level.
Resolve issues in the earned hours model
As mentioned in our previous post, the first step in this analysis should be to ensure there are no issues with the earned model. In our example, we see the store is recording 494 hours attributed to the Beer & Wine department. However, our model is not crediting any time for that offering. This is an obvious indication that we may have overlooked this category during setup. After verifying the offering does apply to our particular store, we add it and update the model.
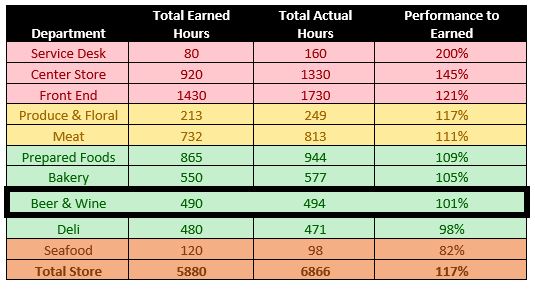
We’re off to a good start! With all obvious errors in the model now corrected, it’s time to investigate potential operational issues in the store itself.
Confirm the store is reporting hours correctly
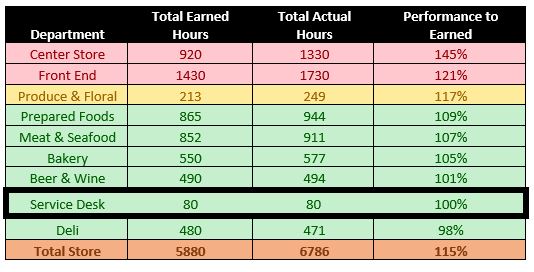
Reporting hours is not always as straightforward as it seems. Many retailers lose accuracy of reported hours the deeper they go into department structure. Additionally, many work tasks may be shared across groupings of similar departments, making it difficult to separate where time should be allocated. In our example, we see that Store 0027’s Meat department is recording too many hours, while Seafood is recording too few. Upon further investigation, we find that there are many shared work tasks between the two departments, and for practical reasons those hours for shared activities usually get reported to Meat instead of Seafood. In this case, it makes sense to examine Meat and Seafood together, similar to Produce and Floral.
After combining Meat and Seafood, we see that those departments are collectively performing well within the green zone. Although our results at total store level have not changed, we’ve further narrowed the investigative field and gained some valuable insight.
Verify that staffing of coverage positions aligns with expectations
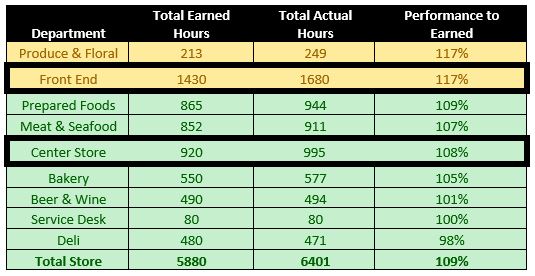
Certain job roles in a store may be staffed based on fixed coverage expectations driven by corporate customer service, productivity, financial or other goals. Sometimes stores might be unaware of these expectations, which can result in coverage positions being manned too early in the day, too late, at the wrong quantity—or not at all. In our scenario, we would schedule a call with Store 0027’s Front End manager to review coverage expectations as a step in uncovering any misalignment. In this case, we discover that the store has been staffing two Service Desk clerks instead of the formal expectation of one clerk, which is why its Service Desk hours are double what they should be.
Working with the Front End manager, we are able to correct the Service Desk staffing misalignment and achieve 100 percent performance to earned status. Actual Service Desk hours now match up exactly with earned hours for the department.
Perform a methods audit
An earned hours model is built on the assumption that associates are following the approved standard practice for performing work tasks. This is especially important regarding work tasks that make up the majority of hours, often called Pareto-significant work tasks. Derived from the Pareto Principle (also known as the 80/20 rule), in practice this equates to the 20 percent of work tasks that consume 80 percent of total hours. Often when a department is struggling to achieve its performance targets, the underlying cause is a failure to follow standard practice. Performing a simple methods audit can quickly identify issues.
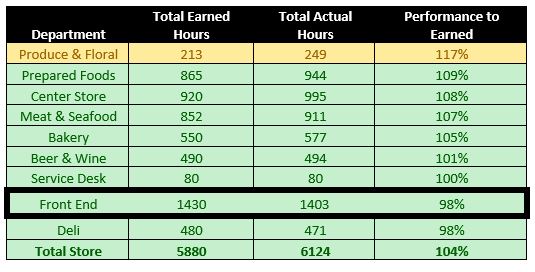
Using our example again to illustrate, we see that Store 0027 is using significantly more hours than it earned in Center Store and Front End. As such, we will focus our audit on those departments. To initiate the process, we send the current standard practices that should be performed to store leadership for review. This helps identify any tasks being performed that shouldn’t be or vice versa. Upon review, the store in our example identifies they are still performing an inventory process that was discontinued the previous year.
Next, we request that department managers spend time observing associates performing Pareto-significant tasks to validate the method used. The most significant activities in Center Store are receiving, stocking and blocking, so we focus on those for observation. The department manager verifies that the store is performing stocking by spotting cases in aisles for later processing, which is not the standard practice of stocking directly from mobile carts. The store is also performing a full block of Center Store twice daily, whereas standard practice is to only block once daily.
Methods audits can also identify equipment issues. For example, cart collection is one of the most significant activities on the Front End, and as such is targeted for review. During the review process, the Front End manager identifies that their cart collection machine has been broken for 6 months, resulting in associates taking significantly more time to collect carts by hand.
Once the methods audit is complete, we review the findings with store leadership to craft a change management plan. Our example store’s performance is really starting to look better; however, there is still room for improvement!
>
Measure associate performance
Even after the methods audit in our example, Front End is still high on hours. While following correct methods is critical, it is not the only component of productivity. Realizing the largest driver of hours is customer processing, our next step is examining cashier performance—a metric that many grocery retailers track systemically. This analysis reveals that cashiers at this store are averaging 16 items per minutes (IPM), while the chain average is 19 items per minute. A variety of factors could be contributing to the lower IPMs, such as high cashier turnover, inadequate training, lack of produce lookups, etc.
Identifying the problem area helps guide further root cause investigation and enables store leadership to put a change management process in place to address the performance issues. With cashier performance improved, the Front End is now performing much closer to expectations.
Double-check for any uniqueness
Lastly, stores sometimes have unique attributes that are difficult to account for upfront. Examples of such attributes might include problems with turnover, irregular layouts, or offerings that are specific only to that store. One significant advantage of an earned hours approach is that it brings these types of unique circumstances to light that might otherwise stay buried.
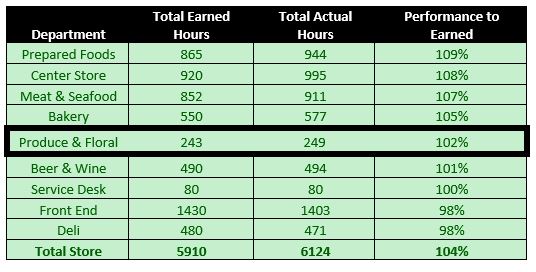
Returning to our example, all departments except for Produce & Floral are now in the green zone of acceptable performance. To pinpoint the cause of Produce & Floral’s excess actual hours, we revisit the Produce store-specific characteristics to see if there are any unique aspects that may have been missed. We send a short survey of characteristics for store leadership to verify. The process is quick and takes the store less than 30 minutes to re-survey the Produce department. After the results are validated, we discover this store has a produce cooler that is located at the opposite end of the store from the Produce sales floor—whereas at all other stores, the cooler is attached. Since this attribute was unique to only this store, it’s easy to see how it was not originally accounted for. Now we can credit this store more hours to cope with the distance from the cooler to the sales floor.
And there you go: all departments are now operating in the green zone! While there’s still room to get better, we’ve significantly improved Store 0027’s performance. The store is now using almost 10 percent fewer hours, and we can be very confident in the hours allocated to the store.
So, would your labor team have to physically visit every store like this to address the issues? Certainly not. Once you identify departments with significant variance, a number of processes can support investigation and resolution. And as we’ve seen here in our example illustration, much can be accomplished by utilizing surveys for store characteristics, discussing department details with a call to the store director, or asking managers to assess whether employees are following best-method procedures—all without requiring an on-site engineer. Stores can also be asked to record how their time is actually being used for a week to uncover tasks receiving either too much or not enough time. The concepts we’ve reviewed can be deployed in a variety of ways with the aid of systemic solutions… but that’s a post for another day!