The original convenience store (c-store) concept was a gas station add-on enabling consumers to grab a soda and pre-packaged snack while pumping fuel. Over the decades, it has grown into a complex retail environment serving multiple consumer needs. Modern convenience stores offer a range of products beyond fuel and snacks (see Part 2), including groceries, fresh cooked food, customizable sodas and coffees, alcohol, health and beauty products, and more.

To accommodate new offerings, c-stores have grown their real estate footprint and the size of their workforce. Effectively managing a larger employee pool, in addition to navigating retail challenges including labor shortage, changing customer expectations and regulatory mandates like predictive scheduling, requires a sophisticated, data-driven approach to demand forecasting that supports accurate and effective labor planning, scheduling and execution.

Evolution of convenience retailing

Over the past three decades, consumer demand for convenience store shopping has exploded. The industry has grown to more than 152,000 stores in 2023, according to NACS. Where before most c-stores were single-store businesses, two decades of industry consolidation have resulted in many chains with dozens of stores and some that operate hundreds and even thousands of stores. In both the U.S. and the U.K., the larger chains have become increasingly dominant, setting the industry trends and shaping and adapting to consumer shopping preferences.

U.S. c-stores are becoming all-in-one shopping destinations where customers can pick up essential frozen, fresh and pantry groceries, fill up the tank, and grab takeout breakfast, lunch or dinner. Some c-stores prepare their own fresh food, others have incorporated fast-food franchises within the four walls of the store. Increasingly, convenience stores are popping up within interstate rest areas and mass transit stations.

The unique role of convenience stores opens new opportunities to meet consumer needs

Convenience stores offer consumers a unique value proposition. In terms of speed and ease of shopping, there’s no comparison between c-stores and traditional grocers or quick-service restaurants. NACS Speed Metrics Research revealed that customers come inside, choose items, pay for them and depart a convenience store in just three to four minutes. This short duration between entering the store and completing checkout means stores must be optimally staffed and prepared to deliver efficient customer service across a variety of areas.

Customers count on convenience stores for:

  • The first cup of coffee that carries them through their commute to work
  • A quick stop for fuel and a consistent food experience when they are traveling
  • A convenient place to pick up takeout dinner on a hectic day
  • The closest source of essential groceries in many rural towns and urban food deserts

As stores continue to level-up based on consumer demand for healthier fresh foods, a wider selection of mini-grocery offerings, barista-level coffee, and more, their operational complexities expand in parallel. These innovations provide important opportunities to grow the business and open new revenue streams, and c-stores are now competing directly against traditional grocers and quick-serve restaurants for a greater share of consumer spending. However, success with these expanded offerings requires that c-stores equip themselves with the ability to manage and schedule the additional people and activities needed to support them.

Leveling-up requires a new labor model

Offering new products and services means convenience stores must expand labor budgets and hire and train more employees. Beyond the traditional three employee tasks of stocking, cashiering and cleaning, the new model of expanded operations depends on an expanded staff trained in how to bake donuts, make pizzas and chicken tenders, tend to a coffee bar, and maintain food safety.

Traditionally, a small c-store might only need one or two employees per shift. Today’s operations might require several people during busy times, and managers need to match employees with the right skills to the tasks at hand. For example, you might only need cashiering and stocking at midnight on a Tuesday. Fast forward to 12 am Saturday in a college town with a home football game, and you may need a whole team of pizza and snack cooks to keep up with demand for late-night treats.

Accurate demand forecasting provides the foundation to effectively plan, schedule and execute store operations

C-stores must be able to forecast customer traffic as well as peak demand for fresh-cooked items with great precision. Better forecasting will ensure stores schedule the right team members at the right times to satisfy customer demand. It also helps avoid food waste by ensuring employees cook the right amount of food to fill customer demand quickly while avoiding spoilage.

Before creating a schedule, store managers need to forecast what will happen in the coming weeks. This includes predicting sales volumes at the item level and preparing for the associated workload at the task level. The accuracy of these forecasts will drive both inventory management and labor management for the store.

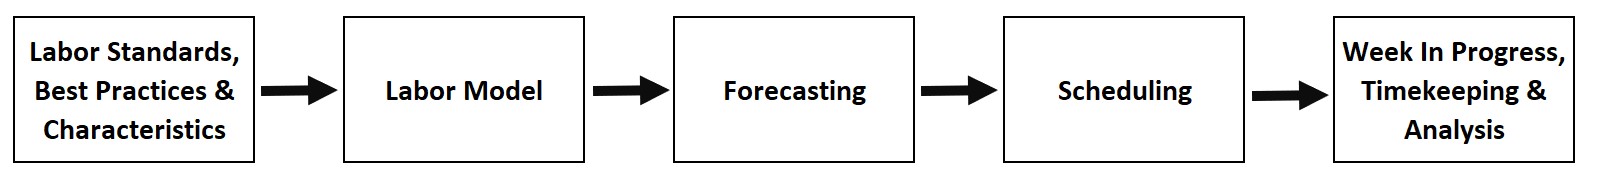
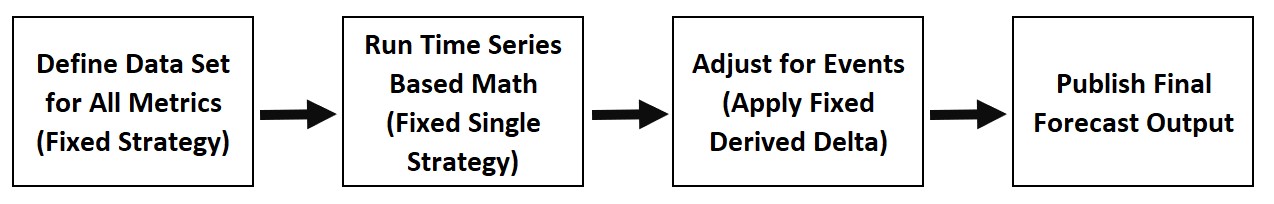
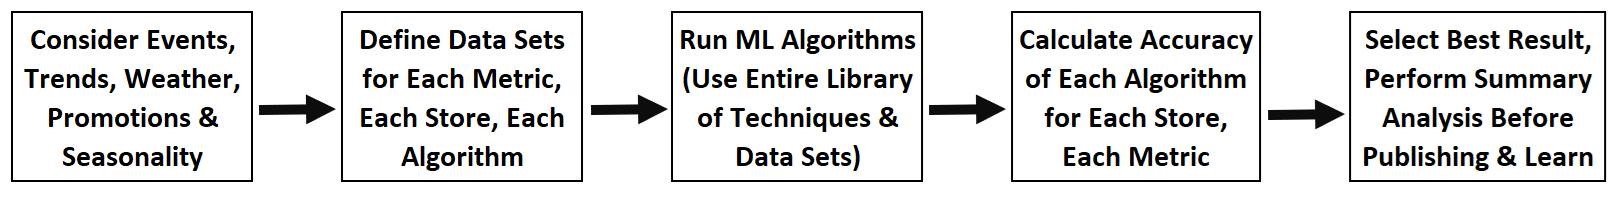
Advanced AI forecasting technology helps c-store operators optimize scheduling and contain labor costs while ensuring an excellent customer experience. The best solutions produce multi-dimensional, multi-layered forecasts that project demand based on historical sales and additional aspects like weather, holidays and seasonality that all impact foot traffic. With an understanding of demand and precisely what work needs to be done, a good forecasting solution works with labor modeling and labor standards inputs to understand how much time it takes to perform specific tasks, like stocking a shelf, preparing a pizza, refilling the soda machine, and baking the donuts, and how many people are required at what times for adequate coverage. The resulting forecast predicts the times of day and number of repetitions these tasks will take place.

Integrated with state-of-the-art scheduling capabilities containing advanced AI logic driving compliance with rules, availability, priorities and more culminates in a schedule with the right amount of task coverage by people with the documented skills to perform those tasks. And to meet the expectations of today’s connected workforce, communicating both schedules and tasks to staff through a mobile interactive employee portal that provides work assignments, task guidance and enables self-service activities like changing availability, bidding on or swapping shifts further facilitates both operational effectiveness and employee satisfaction.

A demand forecasting solution that produces a reliably accurate baseline forecast weeks in advance and subsequently refines that forecast via continuous reforecasting over time based on real-time information not only improves operational results, but can also ultimately translate into better recruiting and retention results by helping c-stores offer more flexible and predictable schedules. Pinpointing the number of people and skills needed for any shift well in advance facilitates schedule building and advance communication of employee schedules to help comply with Fair Work regulations and predictive scheduling rules. Automated scheduling and self-service further enable stores’ ability to generate highly accurate task-level schedules while streamlining and honoring employee preferences, communication with managers and peers, shift changes, job resources and more.

In closing

Convenience stores have come a long way since their pared-down origins, and their expanded breadth of offerings has translated into more complicated staffing and operational needs. An expanded labor model and sophisticated AI demand forecasting integrated with powerful AI scheduling logic and task management capabilities set the foundation to optimize operations and create positive employee and customer experiences. As convenience stores continue to evolve, successful operators will leverage these advanced technologies to streamline labor planning, scheduling, tasks and store execution while enhancing profitability and competitive edge.

Ricardo Romo, Industrial Engineer
Femi Olowu, Implementation Specialist
Brie Urick, Senior Industrial Engineer
Damien Deem, Implementation Specialist

Lane Configuration: An innocuous set of words but a concept that retailers strive to perfect in order to ensure great, quick and efficient service for their customers. Its importance cannot be overstated. It is central to the perpetual goal of all retailers to improve and maximize throughput, which we flagged in part 1 of this series as having a significant impact on customer experience (don’t miss part 3).

What is throughput?

Throughput is the rate at which goods and services are processed. For retailers, throughput is how quickly and efficiently they can process their customers and items and reduce queuing, which is the accumulation of customers waiting to be served.  Lane configuration is a significant component in improving throughput. Today’s front end is more complex than ever: regular and express lane types, self-checkout, e-commerce (in house or third party), scan and go, to name just some. Balancing operational capacity across each of these to maximize throughput is daunting. It requires the right answers to such questions as:

  • What shopping patterns do my customers follow?
  • How do I effectively and strategically schedule my employees to coincide with how my customers shop?
  • How do I make an accurate prediction in order to schedule accurately for customers?
  • Do my managers have and use the information effectively to reduce queuing and provide customers with a better shopping experience?

Getting the right answers necessitates a system that can analyze historical data and shopping patterns to forecast scheduling requirements, assuring that the right components are in place to avoid queuing concerns. Getting it right, resulting in reduced shopping time and the ability to make shrewd choices in labor use, will lead to positive results in sales and profitability.

The traditional approach

To help understand the ways in which accurate forecasting tools help, let’s talk for a minute about how retailers have historically approached the significant challenge of lane configuration.

Lane configuration challenges

Little thought was given regarding what type of registers were needed at a particular time. Large numbers of lanes were opened without considering the size or quantity of items customers would have. Express orders were mixed with large orders, resulting in long queues for both, creating frustration. To address this, retailers introduced new areas and/or ways to check out. Self-Checkout, BOPIS (Buy Online, Purchase In-Store) and other formats were attempts to introduce variety and options for customers. To a limited extent, it worked. However, it still did not address the underlying issue of how to schedule to what a business really needs to be successful. Customers still left upset, feeling that their time and money are not important.

Scheduling complexities

Accurately forecasting the right balance across configurations at any given time of day was not easily possible. There were numerous issues with queuing, traffic flow, mis-scheduling of appropriate registers (both in type and number), and a lack of process for managing that resulted in lost sales, poor or ineffective management of payroll and resources, and a general decline in profitability for the business.

Next-gen front end planning

So, what type of forecasting will help in this situation? Demand forecasting. Demand forecasting is the ability to anticipate what will happen and to schedule accordingly. The accuracy of your forecast will depend on how you use the data your forecasting system has collected, with the tools available to help one make the best decisions. As in any process, “garbage in, garbage out.” Use bad data—or a bad hunch—and you will produce a bad schedule. Use good quality data that has been thoroughly analyzed, with the considerations we have discussed above, and you can produce a schedule that will accurately anticipate and take care of your business needs.

Data driven decisions

Accuracy and specificity are key. The granularity of the historical data is crucial. Providing historical checkout data split into intervals will increase accuracy as the time interval becomes smaller; for example 15-minute intervals rather than 1-hour intervals. Using this data, with historical trends concurrently, is powerful. Retailers can use this data to produce a demand forecast that predicts how customers behave in specific locations, at particular times of the day, seasonally, and the mixture of customer type. They can then schedule and plan lanes accurately, so at any given time they have the right configuration to process customers efficiently, reducing both wasted labor and queuing, and providing customers with the service they deserve.

The journey to improving front end operations management

So far in our exploration of “Improving Front End Operations Management,” we have discussed several topics. In the first of this four-part series, we discussed how the changes in business over the years have impacted front end management, and the challenges these changes have posed. With competition, decreasing profitability, and the increasing parity between retail locations, operation of this department has become more agile. Here we have explored how forecast accuracy supports improving front end throughput and queuing with predictive scheduling. In the next installment, we will narrow our focus to cashier performance and examine how effective coaching can further improve throughput as well as employee satisfaction.

In part one of this series, we introduced a statistical approach used in baseball called sabermetrics—the methodology employed in the 2011 hit movie Moneyball. Based on a true story, the movie depicted how the Oakland Athletics’ (the A’s) General Manager Billy Beane (portrayed by Brad Pitt) faced the challenge of building a successful team on his franchise’s limited budget. He hired Assistant General Manager Peter Brand (portrayed by Jonah Hill) to utilize sabermetrics to scout, analyze and place players in their optimal positions, which resulted in a record-breaking 20-game winning streak.

As we saw in our first post, sabermetrics has some very strong similarities to analytic approaches currently being used in retail environments. One particularly interesting and relevant connection is how sabermetrics provides predictions of future performance for a given player or team. When past execution data is available on a player or team, sabermetrics can predict the average future performances for the next season. Thus, it’s possible to make predictions with a certain probability about the number of wins and losses.

Intelligent forecasting is key to predicting retail performance

Predicting future metrics, like sales, items or customers, in retail is extremely critical to future planning but is also very complicated. In retail, this is called forecasting. Forecasting has seen tremendous advancements in the last several decades. Not only can numerous algorithms be utilized to forecast future metrics, but using artificial intelligence, machines can become more accurate over time. Yet some retailers still use basic year-over-year growth calculations to produce this critical forecast that drives all planning efforts for the business. This old-school approach lacks inclusion of seasonality trends, misses recent sales patterns, and omits inflation changes, to name a few outdated aspects.

New advanced prediction models use machine learning and algorithms to produce forecasts and budgets that help retailers better understand their anticipated needs versus taking high-level guesses at them…or worse, bundling them all together by “focusing on key items, and just applying a general set of assumptions to the rest.” Taking years of historical data in combination with tags that highlight certain events such as sales, holidays, weather and more allows machine learning to produce forecasts that are far more accurate than the old approach.

Bringing it to life

Let’s draw from an example in the movie Moneyball to help illustrate this point. After Beane hired Brand, Brand’s first day on the job included his 51 player evaluations for Beane. Brand used elaborate projection algorithms to take historical player performance metrics to produce projections for each player. This provided Beane with a full understanding of how a player is forecasted to perform overall. He then used that to build out his entire team, which went on to set the winning streak record that year. Although this post speaks more to forecasting data metrics in retail, the predictive advantage seen in sabermetrics is similar to what we find in retail when organizations forecast effectively.

While many retailers understand the need for accurate forecasting, they find it really difficult to implement. According to RSR Research as cited in the post linked above, there was a 20 percent gap between those great retailers that found forecasting valuable and those that actually utilized it. One major reason is because of forecast error, an issue that antiquated forecasting systems cannot consider due to the variable complexity that a retailer must account for when developing predictions. How does a retailer handle forecast error? Beyond hiring the best demand planners in the business, consider hiring a vendor that has both the industry expertise (e.g., knows which variables to consider) and the technological capacity (e.g., knows how to include those variables in algorithms) to help.

With forecasting methodologies continuously evolving with machine learning, it’s critically important for retailers to stick with that evolution journey. Just like Beane advanced his player prediction approach by hiring Brand, retailers should also be looking for how they can advance their forecasting approach by using the latest technology as well as best-suited vendors with the industry expertise to take it to the next level.

There are several components involved in building a workforce management system capable of delivering competitive advantage to retailers. If you depict those components in simplified process order, you typically get something like this:

Simplified Workforce Management System Process

While this is a simplified depiction, it highlights the central role of forecasting as the linchpin in the WFM component chain. Unlocking the higher value proposition of all these components relies heavily on accurate forecasting to deliver the upstream and downstream potential of each of the other components.

In this post, we will discuss why that’s the case and why the new layers of benefits are exposed using artificial intelligence (AI), near real-time data exchange, machine-based learning (ML) algorithms, faster cloud-based enterprise computing, applied industrial engineering, and smart retailing. Leveraging the potential of emerging technology will unlock competitive advantage for those who invest in it.

What’s new in forecasting?

Faster computing platforms coupled with AI and ML algorithms have led to breakthroughs in forecast accuracy. The combination of better math and faster processing can out-gun older, static approaches to every step of the forecasting process. 

At a basic level, here’s the old process:

wp:image {“align”:”center”,”id”:14023} –>

Old Forecasting System Process

While older systems allowed you to change the math, it was one-size-fits-all for the strategy in use for a given week. Same data selection, same math applied to all metrics (sales, items, customers, cases, etc.) The math used for forecasting involves linear programming, also known as time-series algorithms, with averaging or trending, or both. For each event, the system looks back into history and tries to determine how these events change the forecast. If an event has a historic impact of lifting sales 4 percent, then your base forecast sales are increased by 4 percent.

When fine-tuned as best you could for an “average week,” this left you with far less accurate forecasts whenever holidays, events, seasonality, weather and promotions were significant. Even recurring events such as pay periods, EBT releases, etc. created misses due to the day-of-week repositioning of these events. It was a hard sell to get managers to “trust the system” when the system could be fairly accurate 60 percent of the time, but wildly inaccurate whenever these variables arose. Meanwhile, the volatility of promotional events, competitive activity and weather has never been more pervasive.

With a library of AI and ML algorithms, the process is more detailed and powerful. At an overview level, here’s the new process:

wp:image {“align”:”center”,”id”:14025} –>

New Forecasting System Process

Without getting too detailed, the differences stand out. Whereas the old methodology, which is still typical of most WFM forecasting solutions, relies on a single data set (last 4 weeks, last 8 weeks, etc.), the data set for the AI and ML algorithms varies by algorithm and is both informed by the events and selected appropriately for each algorithm. The data sets are also unique by store and for each metric. Events are handled after the fact in the first process, while they are fully integrated into the data set selection and adjustment process in the new approach. This layered-in approach produces better results in handling events, including transposition from day to day for those events that move from historical occurrences.

Once you do the math and apply the event adjustments, the old process is done. In the new processes, the result of each and every algorithm undergoes statistical analysis so that the most statistically reliable algorithm for that metric, for that store, for that type of week is selected. Even then, final macro analysis is applied to finalize the results. The difference is significant: it is akin to picking just one tool from your toolbox versus using and benefiting from the entire workshop of tools.

Don’t forget that learning algorithms learn. That means your tools are constantly recalibrating, resharpening and reengineering themselves based on your ongoing experience. AI empowers smart systems to get smarter, and ML enables algorithms to learn. If your current system isn’t getting smarter by learning from your history, how do the outputs get better for your stores? Accordingly, early adopters will create a leading competitive advantage.

Improved accuracy is indisputable

Find a vendor who will perform the analysis for you, and your results will be compelling. The newer approach to forecasting consistently wins. Vendors with old functionality will have you focus on higher-level forecasting like weekly sales. They find safety in big numbers that can cancel out daily variances. But the new approach always delivers better results. What’s even more telling is looking closer at daily store sales, daily department-level sales, and interval sales throughout the day. The results become ever more compelling as you look closer and closer at the scheduling impacts.

Translating higher accuracy into hours saved downstream

What’s the value of getting just $1,000 more accurate in forecasting per week? Simple store sales per hour (SPH) might initially lead you to calculate that value as 5 to 7 hours, depending on your current production rates. But consider that labor really gets planned at the daily level. So $3,000 over on one day, and $2,000 under on another start looking more like 25 to 35 hours misappropriated than 5 to 7. And, consider then that labor is most typically scheduled at the department level. The error from department to department can apply an even bigger multiplier to poorly positioned or ill-spent hours. 

How many hours might be saved or better put to proper use varies with your current forecast inaccuracy. It’s up to you to determine the value of an hour saved and the value of an hour not spent where it is needed. Even with modest improvements, the numbers roll up into a lot of hours. Some of those hours are saved, some of those hours are better spent. Some of those hours are currently causing overtime. All hours come loaded with some level of benefit expense. Be reasonable in estimating, but brace yourself if you estimate the annual number across your enterprise. The numbers can be eye-opening, and the opportunity is compelling.

It’s an often-quoted statement that “you can’t get a good schedule out of a bad forecast.” It is also very true. Hours overscheduled in one department don’t justify service poorly delivered in another. Spending too many hours in the morning and too few hours in the evening creates inconsistent service expectations, jeopardizes sales and puts customer loyalty at risk. Of course, managers can adjust during the day or week in progress, but how easily does that happen with your current WFM tools, and at what cost? Accurate forecasting reduces variability for the week in progress and allows store personnel to execute your brand, your merchandising plans, and your service standards with far less waste.

The upstream value propositions for labor standards and labor modeling

If the downstream value is clear, how does forecasting improve the upstream process for labor standards and labor modeling? Many companies working to build a WFM platform for competitive advantage have work to do in systems, standards, data, standardized practices, and store-level execution. It is difficult, if not impossible, to address all of these elements at the same time. Long term, there’s a need for a paradigm shift to store execution supported by smart system best practices, rather than each manager doing their thing in their own way with unreliable system guidance.

Organizations that have focused on forecasting first can leverage basic approaches to calculating hours and be more deliberate about defining best practices, building engineered standards, and enhancing labor modeling. They’ll open the door to enable modeling of standards and drivers to engineered task time while they reduce wasted hours due to forecast inaccuracy. 

For store managers, having a system you can rely on starts with an accurate forecast. It’s fundamental to the paradigm shift, and it’s a solid foundation for both upstream and downstream benefits to build upon. If you want competitive advantage through your WFM solution set, start by upgrading your forecast and build from there.

In the ideal retail situation, labor analysts can focus their attention on data interpretation, allowing their information technology to do heavy data mining. Alas, this is rare. Many labor teams require analysts to gather and shape data prior to analysis. In the worst-case scenarios, retailers have understaffed or non-existent labor teams to complete these tasks. I empathize with retailers in this struggle. When analysts are required to gather and shape data during workforce management (WFM), they are less effective than their competitors for several reasons.

Data analysis detriments

First, this combination leaves room for human error in a complex array of workflows, from work measurement to scheduling effectiveness. Second, the necessary data massaging that occurs prior to interpretation takes considerable time, providing analysts with less energy and capacity to focus on fine-tuning the details that matter in getting schedules to stores. Third, the extra time to send important information to store managers and employees leaves associates at a disadvantage as they rush to implement labor plans, ultimately dissatisfying customers and benefiting competitors.

This scenario certainly varies from our ideal. However, there can be a bright and hopeful future on the horizon if retailers consider a shift from data to systems thinking. Systems thinking involves the utilization of tools offering wall-to-wall labor management and implementation capabilities. For analysts who use systems thinking and analysis, data is at their fingertips to be arranged, rearranged and configured for actionable review. Analysts can quickly see issues and call them to leadership’s attention.

Systems thinking overview

The shift to systems analysis requires a technology investment, but it includes a significant return. Research shows that putting the right people in the right place doing the right things at the right time causes a ripple effect of organizational productivity and profits. However, few WFM solutions do this well. Retail customers expect an excellent experience that includes stores with a lovely atmosphere, stocked shelves and on-cue service. Organizations that can accomplish this will lead the industry. Investing in technology that offers retail leaders time to focus on the important things is imperative.

This can be done by ensuring WFM tools are calibrated in a way to catch outliers so that analysts can understand them and make decisions based on that information. The best WFM systems pull the data together, while the labor team summarizes information to help managers lead the business. Many best-in-class WFM tools are intuitive and self-learning, leading to more accurate plans, forecasts and schedules every week. This allows small labor teams to transition their focus from wrestling with data to more value-added pursuits, like fine-tuning the system, training store users or instilling best practices into standard operating procedures.

The optimal labor management journey

Let’s take a walk through the labor management journey to see how a great WFM system will aid labor analysts along each step of the way.

Work standards and forecasting

A wall-to-wall WFM system starts by providing actionable checks and information updates to labor analysts. Beginning with work standards, operating procedures and labor goals, the system should include effective-dating and data flow checks. Afterwards, the system should forecast at every business level and allow the retailer to differentiate between versions. A great forecast is built from the lowest tier and checked upward for accuracy. Here, the system can also monitor data set points and proactively notify analysts around potential issues.

I have heard retail gurus talk about forecasting as the cornerstone to effective, wall-to-wall store planning; thus, systems thinking in this space is monumental for labor teams. Some WFM systems let users make edits to system-generated forecasts, but few use automated technology to feed those edits back into the system, allowing it to learn from its mistakes and get smarter. It is important that labor teams have visibility into the accuracy of each forecast. The more instinctive the system, the fewer edits the labor team makes over time.

To summarize, a world-class WFM system will include the following functionality for work standards and forecasting:

  1. Standards and labor model transparency
  2. Forecast version control
  3. Quantifiable forecast accuracy
  4. Anomaly identification
  5. Automated system learning

Staffing

With work requirements and a great forecast, the system workflow moves onto creating staffing demand. A very complex but necessary step is to ensure labor requirements and service standards match. This is instrumental in labor management; does your WFM system create staffing demand? The system must compare staffing requirements against work requirements to ensure no gaps exist. If a gap is present, a great WFM system will provide actionable details around necessary changes. This ensures things like minimum coverage and safety valves (as a part of queue management) are in place to meet service expectations.

Scheduling

As a final step, WFM systems use staffing demand to create optimized schedules by building shifts covering work requirements and employee constraints. The best schedules utilize task-based workload planning. A labor team wastes time writing schedules that a WFM system can provide automatically. The system covers all work requirements, staffing necessities and scheduling rules and directives. If a retailer’s WFM system is self-learning, schedules become more and more accurate over time. For a small labor team, this sounds dreamy!

Wrapping up

In conclusion, where gathering and shaping data was necessary in days past, machine learning WFM systems now provide the mining work for labor analysts. I have seen this work first-hand and believe in its effectiveness. Retail is a small-margin business, making any competitive advantage important. Thus, moving from a data to systems analytical perspective with the right tools could lead a retail business into greater profits.

Consistency can be a helpful tool in the retail industry. For instance, customers want to know what to expect when entering an establishment. However, regarding technology, solutions are regularly changing how we operate businesses, and what was convenient and optimal years ago might be archaic today. Old technology can even become a limitation when systematic updates and continuous improvement outpace solutions’ capabilities.

Two areas enhanced by continuous improvement in many retail chains are labor scheduling and inventory management. In the past, managers would schedule associates or order supplies based on their experience, inclusive of factors like preferences, certifications, weather, seasonality and clientele. Today, we have self-learning forecasting tools that use a host of algorithms and historical data to predict the aforementioned factors, providing incredibly accurate staffing and inventory.

The challenge

Although forecasting improvements provide benefits to many retailers, implementing systematic upgrades can be very difficult for other businesses. In fact, the costs of bringing in new information technology tools are often high, warranting a “postpone until next year” mentality. So why upgrade? Great question. Today’s blog post will outline some thoughts around the clear advantages inherent in improving your forecasting system. This effort is to add considerations to your cost-benefit analysis during your upcoming budgeting cycle.

The financial benefits of upgrading

One of the greatest assets to utilizing an optimal forecasting system is the positive financial windfall evidenced over time, regardless of whether forecasting is implemented for inventory or labor management. It turns out they are intricately correlated; by accurately estimating customer demands, shelves can be properly stocked with the right amount of product by a properly staffed store. Forecasting is woven into inventory, staffing and scheduling management. It is the glue for the flourishing retail store of the future.

Hard numbers support this assertion. In 2015, McKinsey and Company’s Laul, Schlogl and Silen1 found that retailers who applied data-driven approaches to labor scheduling and budgeting reaped between four and 12 percent cost savings, while increasing overall customer service. McKinsey’s Glatzel, Hopkins, Lange and Weiss2 found that retailers using replenishment forecasting solutions with machine learning reduced out-of-stocks by 80 percent, reduced write-offs (i.e., shrink) and days-on-hand by 10 percent, and increased gross margin by 9 percent.

The competitive benefits of upgrading

Additionally, soft benefits accompany forecasting upgrades. Management experts like Ram Charan3 note that retailers who stay ahead of the competitive curve by incorporating myriad numbers of variables in their forecasting models will lead the industry. In his 2015 book, Charan3 describes how thriving businesses embrace uncertainty. One way we believe retailers can do that is through systematic forecasting solutions that use state-of-the-art algorithms and machine learning.

The supply chain benefits of upgrading

When forecasting is done well, with the support of internal leaders, store staff and knowledgeable vendors, the implications reverberate throughout the organization. For instance, as forecast accuracy increases, distribution centers and even manufacturers reap supply chain benefits. Also, effective and predictable planning strengthens omnichannel marketing. In other words, forecasting helps ensure store products are available online when customers desire them, which keeps customers coming back.

Let us wrap up this short exposé on how upgrading your forecasting solution might give you a competitive edge. We reviewed that things change quickly in retail, and although upgrading technology can be daunting, there are tangible rewards for those who do: decreased costs, out-of-stocks, shrink and inventory on-hand, as well as increased customer service and revenue. Remember to include these in your analysis for the next fiscal year!

References

  1. Laubl, D., Schlogl, G., & Silen, P. (2015). Smarter schedules, better budgets: How to improve store operations. Zurich, Switzerland: McKinsey & Company.
  2. Glatzel, C., Hopkins, M., Lange, T., and Weiss, U. (2016, November). The secret to smarter fresh-food replenishment? Machine learning. McKinsey & Company: Retail. Retrieved from https://www.mckinsey.com/industries/retail/our-insights/the-secret-to-smarter-fresh-food-replenishment-machine-learning
  3. Charan, R. (2015). The attacker’s advantage: Turning uncertainty into breakthrough opportunities. New York, NY: Public Affairs.

This blog post continues our discussion on unique challenges faced by specialty retailers in quantifying traffic and workload. In our last post, we discussed the hidden work content implicit in customer traffic and the limitations of point-of-sale (POS) transactional data in specialty retail. Point-of-sale data alone misses the work demand associated with customers who, for a variety of reasons, shop and require support but elect not to make a purchase. Today, we continue on this journey, elaborating on labor standards modeling and forecasting to quantify hidden demand for planning, scheduling and performance optimization.

Getting it Right

Getting the workload right for specialty retailers is the first priority for labor modeling and store planning. Mathematically, workload is the product of volume group occurrences (i.e., transactions, cases, etc.) by the engineered standards, which reflect the time to perform work processes. Those engineered standards incorporate store characteristics, which modify the right standards for unique store variables like equipment, store layout, walking distances, and more to create accurate location-specific standards and store-specific work requirements.

The process for quantifying workload in non-specialty retail is simpler. Grocery and big box operators identify all the activities required to accurately reflect business processes by location, then leverage POS or receiving data to define workload volumes. It is a bigger challenge in specialty retail because there are many hidden components (called “unmet demand” by one author1) that derive from the conversion challenge, which we discussed in last week’s post. If you have not read through part one and two of this series, we encourage it before moving on.

Digging for Data

So where does the data to drive workload volumes come from? There are several options, and some are better than others. A typical approach is to augment the standards using special allowances or frequencies to estimate the hidden demand. The basis of the allowance may be anything from gut-level estimates to quick adjustments deemed within the budget.

But are the hidden volumes the same every day, throughout the day? Are promotions unchanging? Traditionally, the answers to these questions are, “no.” Thus, beware of simple spread percentages. Typically, one or more allowances within the standard grocery approach will not solve the problem, but it will bandage the root issue. We believe the same for specialty retail.

Electronic means of capturing customer traffic can be helpful, including beacon technology, area sensors and video interpretation. However, this technology tends to be expensive, and it can be problematic during interpretation.

For those not yet ready to dive into customer-counting technology, a secondary but equally advantageous option is to address this on the labor standards side. Observational studies and analyses can be completed to inform the labor standards and capture the full picture of stores’ workloads. Two kinds of studies are valuable to enhance standards modeling: utilization and customer journey studies. Below, we uncover the intricacies and benefits of both.

Who is Doing What?

Typically, utilization studies capture facts about how effectively associates are using their time. Are they working? What area are they working in? What type of work are they performing? In grocery and big box retailing, utilization studies offer data into how well the workforce is directed between tasks, how employees focus during their work and where employee time is spent.

Utilization studies are a great way to identify low-priority activities absorbing time but adding little value. Once found, these obstructions can be targeted to eliminate or reallocate wasted time. With the right modifications for specialty retail, we can learn about critically hidden activities like recovery and service interactions. This makes better, more accurate standards modeling possible, which includes the hidden activities not recorded by POS transactions.

Join the Journey

The second data source for augmenting specialty retail comes from customer journey studies, where an engineer tracks a customer through the store from entrance to exit to log their activities without attaching personal data. These take skill to execute in small-store environments but can yield major insights about customer behavior. They often generate ideas concerning store layout, brand merchandising, display effectiveness, customer experience and purchase decisions.

They are also a key data source for hidden workload. For instance, customer journey studies often answer questions like: how many items does one customer touch? How many items require recovery based on the customer’s journey? Does she use a fitting room or consultation services? Does the customer buy? If not, what was the probable cause?

If we can understand the patterns behind customer travels, we can model the required labor content using better data and standards. As Gartner Vice President Tom Enright noted in 2017, the goal is no longer understanding what customers want to buy, but how and why customers are buying2. This starts with data collection and leads to standards management. Solidifying these foundational elements opens a wealth of opportunities for cost-benefit analyses, scheduling optimization and wasted-hours reduction.

In the fourth installment of this five-part series, we will dive into task-level work planning and how vital it is for scheduling the right people at the right time, particularly in specialty retail.

References

  1. Glatzel, C., Hopkins, M., Lange, T., and Weiss, U. (2016, November). The secret to smarter fresh-food replenishment? Machine learning. McKinsey & Company: Retail. Retrieved from https://www.mckinsey.com/industries/retail/our-insights/the-secret-to-smarter-fresh-food-replenishment-machine-learning
  2. Sillitoe, B. (2017, June 15). Retailers urged to change approach to demand forecasting. com. Retrieved from https://www.computerweekly.com/feature/Retailers-urged-to-change-approach-to-demand-forecasting

In the first part of this blog series, our discussion centered around unified commerce’s impact, Industry 4.0’s onset, traditional retailer adaptations and long-term solutions. Regarding long-term solutions, we referenced four potential opportunities (i.e., data mining, forecasting, scheduling and mobile solutions) for brick-and-mortar institutions to optimize their workforce without upending customer service expectations. Let us focus on two of those four opportunities in today’s blog: forecasting and scheduling. Forecasting accuracy is paramount when it comes to the effectiveness of scheduling and mobile solutions. Thus, getting it right must be a priority for brick-and-mortar retailers who desire relevancy in an online age.

Forecasting is so important for retailers that those who fall behind in predictive technology or data processing “are already legacy companies,” according to management author Ram Charan1. In recent business examination, companies who forecast well found better schedules, cost reductions, employee satisfaction, product availability, reduced waste and automated processing2, 3.

Let us begin with the basics of forecasting. First, what is it? Forecasting is, “predicting the future as accurately as possible, given all information available, including historical data and knowledge of future events that might impact the prediction”4. Many retailers have a concept of this; where they trail competitors, however, is in how they forecast.

Retailers who use fixed, rule-based algorithms with variables like sales, inventory, pricing and items alone to predict future purchasing are making decisions based on insufficient data3, 5. For forecasting technology to benefit retailers, it must give leaders insight into each step of the desired management process, such as workforce optimization or inventory control. Organizations utilizing state-of-the-art forecasting technology include variables like social media, weather patterns, shipping requirements, competitor pricing and even celebrity trends3. Let us move on to a second important point. When forecasts are accurate, retail leaders understand operational needs. On the labor side, this directly leads to optimized schedules.

Scheduling is a tricky concept in the retail industry. Antiquated methods included store managers reviewing employee availability and manually creating weekly schedules. Human error prevailed whenever data was overlooked. Today, we have the benefit of using machine learning, a form of artificial intelligence revolutionizing how we do business. In a nutshell, machine learning is a way for forecasting and scheduling engines to become smarter with every piece of data input into their system over time. Machine learning recently showcased incredible savings for retailers through out-of-stock reductions, shrink decreases and gross-margin increases5. When paired with task-based staffing and scheduling, these processes become innovatively effective.

Task-based staffing may be a new term for some. Retailers utilizing legacy methods schedule at the job level; in other words, this is appropriating labor based on an employee’s role (e.g., cashier) versus a store’s needs. Task-based scheduling is a more granular tactic, allowing stores to schedule cross-trained associates at shorter intervals to complete task clusters. Let us look at an example. John Doe is a cross-trained cashier at Store One. Traditionally, a job-based scheduling system might staff John for four hours as a cashier and four as a produce clerk. Alternatively, in task-based scheduling, John is staffed for two hours to open the store (a cluster of task activities), two to restock sale items in grocery, two for cashiering in the front end over lunch, and two to cull products and record shrink in produce. One can easily see the latter method’s adaptability to accommodate customer and store demand. Task-based scheduling is also far more directive for John so that his time is better utilized as needed throughout the departments he is qualified to work in.

So far in this blog, we reviewed several important topics: forecasting accuracy, machine learning, scheduling optimization and task-based scheduling. But…how do these concepts tie into unified commerce? Great question.

As far as we can tell, retailers have four major options moving forward to remain competitive in the unfolding of Industry 4.0:

  • Invest upfront in new technological strategies using the Internet of Things (IoT), artificial intelligence or mergers/acquisitions to adapt to e-commerce.
  • Invest in continuous improvement and expense control to generate capital to later invest in unified commerce initiatives. Forecasting, scheduling, mobile initiatives and process improvements may help significantly in this area.
  • Some combination of the prior two options.
  • Be realistic about what online options will take away from business in the future and invest in meaningful, game-changing differentiators to more than offset the business risk.

As we mentioned in Part One of this blog, unified commerce is sticking around. Retailers must adapt in order to remain relevant. Whether Amazon is a direct competitor or not, brick-and-mortar companies are following suit in their own way to capitalize on new online markets and digital technology. Welcome to the ever-changing world of retailing. We invite you to join a new wave of retailers on that journey.

References

  1. Charan, R. (2015). The attacker’s advantage: Turning uncertainty into breakthrough opportunities. New York, NY: Public Affairs.
  2. Laubl, D., Schlogl, G., & Silen, P. (2015). Smarter schedules, better budgets: How to improve store operations. Zurich, Switzerland: McKinsey & Company.
  3. Sillitoe, B. (2017, June 15). Retailers urged to change approach to demand forecasting. com. Retrieved from https://www.computerweekly.com/feature/Retailers-urged-to-change-approach-to-demand-forecasting
  4. Hyndman, R., & Athanasopolous, G. (2018). Forecasting: Principles and practices (2nd ed.). Melbourne, Australia: OTexts.
  5. Glatzel, C., Hopkins, M., Lange, T., and Weiss, U. (2016, November). The secret to smarter fresh-food replenishment? Machine learning. McKinsey & Company: Retail. Retrieved from https://www.mckinsey.com/industries/retail/our-insights/the-secret-to-smarter-fresh-food-replenishment-machine-learning

This is Part 4 of a 5 Part series on Forecasting by Dan Bursik. To read Part 3, click here.

In my previous blogs related to effective forecasting I have covered several basic concepts that carry forward into this discussion. Whether you want to consider these as key concepts or catchy phrases, here is a quick summary of those ideas:

You can’t get a good schedule out of a bad forecast.
If there is no right place for the hours to be positioned, then you can’t create a good schedule even with a good forecast.
If you haven’t gotten serious about your best practices, labor standards or labor modeling, you probably have bigger challenges to attend to before forecast accuracy optimization.
The better your data and standards can combine to anticipate the work content of your associate’s work plan, the more important that accurate forecasting will become.
Your ultimate objective is to put the right people in the right place at the right time doing the right things.

So if you are at a point where forecast accuracy matters in the correct placement of hours, what is the best way to evaluate the accuracy of your forecasts?

Ultimately, there are two ways. The first is to measure the accuracy of the forecast metric itself against the actual value you experience. Produce customers forecast Tuesday versus Produce customers actually served Tuesday. Or, Deli service counter customers forecast from 1:00 to 1:15 Saturday versus the actual number served at that time.

With this approach you may need several tests to assess whether a forecast meets your needs because the time interval you evaluate for accuracy also matters. Take a simple approach to store sales as a metric. If you test weekly accuracy let’s hope you are within 2 percent of what the actual shows. Is that good enough?

Well, it depends.

Since you don’t place labor on the basis of weekly sales, getting that close at the weekly level doesn’t tell the whole story. If every day was within 2 percent then it sure looks better. But let’s say one day was high by a huge margin and another day was low by an equally large miss. In the total they would seem to cancel one another out. But if you allocated labor by the daily work content, would that be good enough? I think not. Tell the customers who were poorly served Wednesday that you spent their service labor Monday and it won’t give anyone cause to applaud. Two wrongs don’t make a right just because you grade it at a higher level.

The point is that if you are evaluating your forecast accuracy at the metric level then you need to be careful that the level you evaluate is appropriate. And just as errors Tuesday don’t cancel out more errors Wednesday, Thursday morning errors don’t cancel out Thursday evening misses either. Make your evaluation at a weekly, a daily, and an interval level for the best insight possible.

So if grading the accuracy of the metric is the first approach, let’s now look at the second. This approach doesn’t look at the metric.

Instead it looks at the hours you calculate from the metric.

Now, again, this approach is only meaningful if you’ve really determined that there are correct places for those hours to be to do the work and to satisfy all service expectations.

If you can say that, then evaluating whether the forecast hours align with the hours earned from the actual metric volumes experienced is the true test of forecast accuracy.

Again, if your goal through labor modeling is to put the right people in the right place at the right time doing the right things, then what matters in forecast accuracy is the degree to which hours get misplaced – put where they are not needed, or absent from where they are needed. The absolute sum of those differences is what your continuous improvement efforts are geared to eliminate.

You can argue that minor variations, especially in task or production labor don’t cause much pain so long as your workforce utilizes the time and gets all the work done. Of course that does not hold true for hours associated with direct customer service.

Is it possible to quantify the delta between your planned hours and your earned hours? It should be, however it is easier in some systems than in others. Your system should capture multiple iterations of your planning process from the original system forecast and scheduling requirements to those impacted by forecasting or scheduling edits by your central labor team or store personnel. Unfortunately, if your system does not capture that original version you may discover that you have plenty of error but you won’t necessarily know if that error came from system algorithms or through various edits made which may have improved or degraded the original system plan.

If you can clearly quantify the deltas it puts you in a great position to assess cause and effect; to consider the use of alternate algorithms or to consider whether special events or tags ought to have been present as a part of your forecast. If you withhold important information from the forecasting process, there is no way any system can anticipate the impact of the event. Like anything in process improvement, it’s an opportunity to trace and explore the root cause issues and to diminish their impact in future week forecasts. That, to me, is continuous improvement in forecast accuracy.

So, to recap, forecast accuracy is about understanding the gaps between what you forecast and what actually happens. You can evaluate forecast accuracy either at the metric level or based on the hours generated from your metric forecast. If you evaluate the metric elements be sure that the time granularity of your analysis gets to the levels that matter. Start with the weekly but be prepared to go to the daily and interval levels if that is where the metric forecast would impact the placement of hours. You can also evaluate the difference between forecast and earned hours. Arguably, this is what matters most. However, if you do this analysis it may lead you back to the metrics to find the root cause issues in the data set you select for forecasting, in the operations used in the algorithms of your forecasting process, or in identifying the historical special events or tags that your system needs to forecast more accurately.

I’ve got one more blog to offer on this topic regarding best practices associated with accurate forecasting and some lessons I’ve learned over the years. Let me share one that should already be clear: managing forecast accuracy for continuous improvement is not an event, but a journey. It’s a key part of putting the right people at the right place at the right time doing the right things to deliver your brand and satisfy your customers.

This is Part 3 of a 5 Part series on Forecasting by Dan Bursik. To read Part 2, click here.

In my last blog I talked about the need for accurate forecasting as a vital link in the chain of your labor management and operational planning and execution strategies. We touched on three important ideas that are helpful to remember:

  1. You can’t get a good schedule out of a bad forecast.
  2. If there is no right place for the hours to be positioned then you cannot create a good schedule even with a good forecast.
  3. If you haven’t gotten serious about your best practices, labor standards or labor modeling, you probably have bigger challenges to attend to before forecast accuracy optimization.

But let’s assume you are working your way through the labor management process and see forecasting as an opportunity. It’s still important to consider what you are forecasting and whether your general approach for forecast data are aligned with your ultimate objective of putting the right people at the right place at the right time doing the right things. As far as I know, that’s the objective and accurate forecasting is a critical means to that end.

So, think about that objective and consider what you are forecasting and how you are forecasting it. This question concerns the granularity of your forecast element (e.g., department items, category items, specific UPC items, etc.), the time granularity of your data (e.g., weekly, daily, 15-minute interval volume, etc.) and the metrics you are using (e.g., sales, items, customers, etc.) to which you are applying your standards.

Let’s consider the labor needs of a Deli service counter. Some businesses use sales as the major (or even the only) forecast metric to quantify business volume. Some will drive it by items, some by customers and some by pounds – all of which can be supported by data at the department, category, sub-category or item levels. In cases where department information is the driver, then the business portion requiring service labor might be a fixed apportionment of the total Deli. If driven at lower levels, this apportionment becomes much more dynamic by day and by time of day.

Let’s use a set of three examples from Deli to illustrate how the right data can capture or mask the underlying work content. Ask yourself if the time is different for each of these scenarios:

  1. One customer purchases 10 lbs. of sliced ham in 1 package.
  2. One customer purchases 10 lbs. of sliced ham but asks for them to be packaged in 10 packages of 1 lb. each.
  3. Ten customers each want 1 lb. of sliced ham.

I hope it is obvious that although each scenario involves selling 10 lbs. of ham or the same dollar value in each case, the work content of these three scenarios is significantly different. To get each of these scenarios reflective of the right amount of labor and attending to your service objectives, three volume drivers need to be present in your forecasting methodology and, preferably, at 15-minute interval time granularity.

  1. Number of customers to serve.
  2. Number of items (packages) to make.
  3. Number of pounds to slice or produce.

So how does your approach to forecasting Deli service counter workload play out through these three examples? Would your approach capture the labor differently in each scenario?

It’s not that you can’t drive it from sales, or simply from items, or from customers or from pounds; it’s just that the best way to do it is to be able to effectively handle all three units of measure dynamically. This makes package size, and order size dynamic by day and by time of day. Is that important? I certainly know retailers who would say emphatically, yes it is.

If you aren’t forecasting at this detailed level, you need to ask how you provide the right service to your customers and how do you schedule the right number of associates at the right time?

Was it that no one thought to ask if such data could be captured? Was it that your POS or scale systems could not provide it? Was it that your labor forecasting and scheduling system couldn’t manage it? Was it a conscious decision or is it one you should revisit? You could spend the same number of hours in a day but if your business expects higher level of business on the evening than morning, you need to make sure you have better coverage in the evening than in the morning and you have a blend of higher skill level associates in the evening than in the morning.

As to data granularity, are you capturing the details at the department level? At the category level? At the UPC level? Is your labor model thoughtfully developed with the right data? Did you inherit what you got and simply accept it or did you really get what you need to model labor effectively? Are you living with what your information technology team agreed to give you instead of what you really need? Or was your data design dumbed down because of functional limitations of your vendors’ solutions? What is the value of taking a fresh look at the data you need to meet your needs today?

Regarding time granularity, are you capturing and using the relevant data on a weekly basis? On a daily basis? Or at a 15-minute interval basis? Is the data granular enough for you to be providing the best service to your customers assuming you can find a way to forecast at that time granularity?

Is the work of a Deli Service Clerk the only place where this sort of challenge occurs; where multiple units of measure are required to get the work content best quantified? No, aside from any other service counter you may have (Meat, Seafood, Bakery, Prepared Foods, Service Center, etc.) the same is true for many other operations.

Cashier workload should best be split into express eligible and not express eligible (with department registers and self-checkout volumes excluded). After that, their workload is a combination of customer interaction and item processing. Some of the customer processing is direct customer interaction – meet, greet and thank time. Other parts of the customer time should be based on the types of tender being processed (e.g., cash, credit with signature, credit without signature, debit, WIC, SNAP, check, etc.). The items then drive processing time by the type of method required (e.g., scan, key entry, weighed and keyed, etc.).

So, I hope those examples illustrate that the data strategy you take into your forecasting approach really matters. The more reflective you data and your standards can combine to anticipate the work content of your associates’ work plans, the more important that accurate forecasting will become. And just how to measure and improve on forecast accuracy will be a topic for our next blog. In the meantime, take a fresh look at your data and consider whether refinements are in order. Consider whether you are capturing all the right units of measure and if you have them at the right level of granularity.

For forecasting to matter most, there has to be a right time, a best time, for hours to be positioned. Once you have that you can put the right people at the right place at the right time doing the right things!