In first blog in this series on reporting, Next Generation Business Reporting, I staked out a position that the most effective business reporting will always be a combination of traditional reporting plus dashboard, exception based reporting. However, many traditional business reports I have seen need to be updated to create a context for effective business decision making rather than just representing an isolated snapshot of a single data point in time. I also indicated that effective reporting not only speaks to you about Key Performance Indicators (KPIs) that have drifted into the ditch to merit exception alerts, but can be a powerful motivator for what is working well or a prompt for what needs management attention BEFORE it veers of the road.
Now, before my friends put me out to pasture with the “old school” thought group, let me also extol the significant virtues of an effective and robust dashboard reporting strategy. Again, I see these as complimentary, not competing in delivering management focus, awareness, and calls to action where it is needed.
Exception based reporting gained favor as computing resources and seasoned but data-hungry managers and operators reached out to optimize performance by focusing on more KPIs of their business. KPI proliferation in many companies lead to more and more reports, not all of them effectively formatted, and some – created by different organizational silos – offering competing versions of the truth on the same basic metrics. Whether you favor traditional reporting over dashboard exception reporting, or a combination of both, one thing ought to be a given: that the organizational imperative should be to create a single, unifying version of the truth for all KPI consumers. Not doing so invites endless debates and squandered resources.
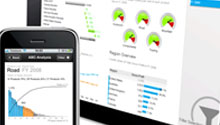
Early iterations of dashboard reporting could be every bit as clunky and useless as a poorly designed traditional report. And all the fancy visuals – stop lights, gauges, arrows, etc. – can’t overcome data without an ability to drill in, see performance over time, or otherwise create a context for effective decision making. Most metrics require context and time relevance. Single data points can be very misleading.
On the other hand, well-designed dashboards can do wonders to provide the means to expand or chase an issue through the data with each drill-down click or available point of reference. Organized presentations of KPI standings can make merchandising KPIs, labor performance KPIs and compliance management KPIs readily available in near real-time with the details poised for investigation. Add in the ability to locate the exception alerts based on appropriate tolerance configurations and you have a great management feedback tool, especially for newer managers who can use the added emphasis that alert notices can provide.
Perhaps most of all what I think dashboards are capable of delivering are the summary metrics that can inform, emphasize, energize, motivate and focus attention on how adherence to a variety of best practice priorities can constitute a summary performance metric: a “Store Score,” a “Department Score,” or an “Effective Rating” score that keeps the full range of best practices within the field of vision of our managers. Summing it all up into a composite score – and better yet, ranking the score recipients – can do wonders to motivate performance. I’m a big fan of ranking reports too – especially when you can create a level playing field for comparison – but you already know that from last week’s blog.


