

Conner Snodgrass, Implementation Specialist
Andrew Drozinski, Customer Program Manager
Mauricio Guerra, Implementation Specialist
In the words of the Old Wild West lawman, Wyatt Earp, “Fast is fine, but accuracy is everything.” Just as in the Wild West, accuracy still matters. In a prior post, we discussed how a forecast is only as good its inputs. Today, we will dig in more on inputs, talk about what “accurate”—defined as the degree to which the result of a measurement conforms to the correct value—really means, and consider various ways to measure that accuracy.
Downstream effects of accuracy
So, you might ask, why is having an accurate forecast important? Empirical evidence suggests that forecast accuracy leads to lower inventory levels and higher profits, which makes for a more valuable enterprise. How much added value is achieved by increased accuracy will vary according to industry and forecast parameters, but it can be significant and may be, in Marshall Earp’s terms, everything.
In the retail world, recent trends to retain employees and to comply with predictive scheduling requirements have retailers forecasting and scheduling weeks in advance. The value of an accurate forecast quickly adds up. An accurate forecast of metrics like sales, items and customers sets the foundation for an accurate labor forecast to ultimately schedule the right people, at the right time, doing the right things, with minimal need for costly last-minute changes.
Recap of Inputs
So now that we know why forecasting accurately is important, what are the components of an accurate forecast? We touched on this topic in depth in a previous installment, but to summarize, a forecast is only as good as its inputs—and one of the most important inputs to the forecasting process is the data. To generate an accurate forecast, we need data that has “Quantity and Quality.” Leading forecasting techniques leverage the use of artificial intelligence and machine learning that build a mathematical model based on “training data.” The greater quantity of “training data” the model has, the better result you will get.
Quality data has three characteristics: it is clean, it is consistent, and it is complete. Quality data should be consistently formatted, devoid of things like typos and invalid entries, and should have a strategy for dealing with outliers. Outliers are data points that differ significantly from other observations. They can wreak havoc on statistical analysis if not dealt with appropriately. There are many potential causes of outliers such as measurement, natural and human error. Each root cause of the different types of outliers will have a different remedy. A sophisticated forecast should have a way to treat each type of outlier using forecast tags. These tags alert the algorithm to the outlier and allow it to compare the tagged data with historical data and decide how to treat it based on prior performance. The best solutions identify anomalies in the data for tagging without manual intervention for an even more automated process.
Once you have large amounts of quality data, evaluate how focused your forecast is. Look for solutions that can choose the best algorithm by store, department and metric. Finally, automation of the process will far surpass what an expert team of forecasters could do.
Measures of accuracy
So now we know why an accurate forecast is important, and what goes into creating an accurate forecast, but how do we measure whether our forecast is accurate or not? Forecast accuracy can be measured in several different ways. It is important to first consider what you are measuring. Forecast vs. actual is a popular measure of accuracy and will tell how your forecasting process is performing in relation to what happened. However, there are other measures of accuracy such as the raw forecast vs. edited forecast. Many organizations give store personnel some latitude to make forecast adjustments. But are they improving the forecast or introducing greater error? Having a system that can measure the accuracy of these adjustments and provide insights to coach those who are editing the forecast is invaluable.
Whether you are measuring the forecast vs. actual or the raw forecast vs. edited forecast you will need a formula to rank and stack the performance. Your system needs to monitor forecast accuracy. If it does not, how do you know how accurate you are and whether you are improving or not? There are many options for quantifying forecast accuracy, but one of the best options is calculating the MAPE or “Mean Absolute Percentage Error.” MAPE measures the size of the error in percentage terms and conveys information despite not knowing the item’s demand volume. Saying “we missed forecast by 3 percent” can be a lot more meaningful than “we missed forecast by 6,000 cases” if the person does not know the typical demand volume. Below is the formula for MAPE:
wp:image {“id”:15795,”sizeSlug”:”large”,”linkDestination”:”none”} –>
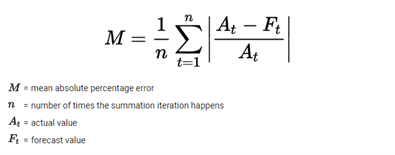
While this formula may seem daunting at first, there is a simple methodology we can use to calculate MAPE:
- Add the absolute error across all items, call this A
- Add the actual quantities across all items, call this B
- Divide A by B
- MAPE is the sum of all errors divided by the sum of actual quantities across all items
Additional considerations
Forecast accuracy needs to focus on the right granularity. Too often, people judge accuracy by the weekly store sales accuracy. A day over-forecasted cancels out a day under-forecasted. A far more meaningful approach (assuming you want to put the right hours on the right days) is department-level accuracy by day. And that analysis should not be limited to sales but to metrics like items, customers, pounds, cases, etc. Once you have the right data and forecasting system in place, it will still be necessary to coach managers on how they use it. Unless your automated system can consistently deliver an accurate forecast, managers will continue to think with their gut and make edits. These edits can degrade the accuracy of your forecasts. Consider implementing several granular accuracy measurements at each step of the forecasting process to be able to improve your performance and provide coachable feedback to store personnel.
Thinking beyond the initial forecast, would there be a benefit to reforecast as more current data comes in? And why not consider short-term weather forecasts for the ultimate finetuning. You may not be able to rewrite the schedules based on the reforecast, but knowing what adjustments are needed, and where, gives your store management team a much more proactive position to serve your customers and maintain your operational and merchandising standards. Sometimes that may involve adding shifts, sometimes reassigning work, sometimes knowing you are over and asking if anyone wants to go home early.