Mike Johnson
Customer Program Manager
Wokingham, UK

I started my career in retail in 1999, which seems and is indeed a long time ago now. I remember being trained at BT Cellnet as one of their first data specialists. Their vision was that everyone would have a “mobile device” that had their bank cards, passport, plane tickets and enable them to watch TV on their phone! This vision seemed very farfetched, even a little science fiction to me. We are talking about the days of WAP, which was mobile internet that ran at a heady 27 Kbps! From here, we have progressed through five generations of wireless internet. With 5G, now you can achieve speeds of 100 Mbps.

Back then, as a store manager, one of my duties was to resource my store effectively. To do this I had to know my team’s availability, scheduling them to what I thought was the average flow of footfall for my store. In reality, that meant everyone in on a Saturday, fewer people in on a Wednesday and spread everyone out over the remaining days. This worked fine for me, and as I progressed through my career, I learned the skill of scheduling. Eventually, I found the best fit for each new store I ran, where I mostly kept a delicate balance between delighting my customers and having a happy team who were scheduled to work at a time that was agreeable to them.

As I moved through the ranks, I developed different perspectives. As a regional, it became clear that the skill of scheduling is not one that every manager possesses. It became clear as a Labour & Efficiency Manager at a large UK automotive retailer that the operations team would feather their own nest to make sure they hit their sales targets. Completely understandable if you are not rewarded on profit.

Every step on the journey gave better insight and clarity on the frustrations that each layer of management in a business using traditional labour strategies faces. Variability is often the single biggest blocker to getting every site profitable, and labour is often the single biggest detractor to a healthy bottom line. So getting your labour plan wrong can be very costly.

  • Just how do you standardise the approach and mitigate skill variability while generating a fair labour plan that can withstand scrutiny?
  • How can any business optimise their workforce whilst achieving their desired customer satisfaction results? After all, customers will demonstrate their dissatisfaction by choosing not to return if they feel their needs are not being met!
    These are often the most challenging questions retail leaders face today. The focus on these issues has intensified over the last decade as we see the merging of technology with e-commerce, the gig economy, and traditional bricks and mortar retail. But, where do you begin?

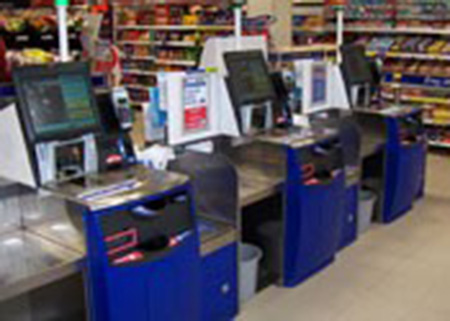
During the early 2000s, technology became front and centre in supermarkets. Tesco introduced the first self-service tills in 2005. The reaction was one of fear from the staff, fearing for their jobs. One of trepidation from the public. The introduction of technology took some getting used to, being served by a “robot” for the first time led to the removal of “basket only” tills in many locations and the ability to supervise 6-8 banks of till points by a single person. This increased throughput of products, reduced queue times and changed shopping habits forever. In 2022, many retailers, from convenience stores to budget supermarkets, have included or are working on plans to include self-service tills.

wp:image {“align”:”center”,”id”:16894,”sizeSlug”:”full”,”linkDestination”:”none”} –>

But what next? What does the future hold for retail, and how will we utilise the advance in technology over the next decade?

Several opportunities are likely to develop:

The move to a more cashless society is likely to accelerate. After the recent impact of the pandemic, more people have moved away from using cash, even away from using cards, as their contactless details are stored on their mobile devices. This presents an opportunity to move past self-service tills and even towards “Checkout free” store operations. We see trials in London already, Amazon leading the charge, but with Sainsbury’s, Aldi and Tesco all following in the last 12 months with trial sites.

On-demand delivery services, again driven by the pandemic, have seen a massive surge in the UK and across the globe. Of course, as it stands, this means a shift in the activities store staff are conducting. At smaller convenience locations, the team picks and packs items for collection by their delivery partner. This is an evolution of the home delivery, weekly shop style services larger stores would service.

This leads to new challenges: how many people does the store need, how many are required on the tills, how do you still serve in-store customers effectively whilst serving delivery customers, what developments will the in-store layout require, will we see new designs to provide better flow of this activity?

One development that we have seen recently copes with the increased demand for home delivery with lead times of less than an hour and utilises unused retail space. Supermarket retailers and hospitality businesses have developed so called ‘dark stores’. At their simplest these are retail or production spaces which have no customers, with systems and processes lifted directly from the traditional operating model built to serve physical customers. Over time these operations will evolve to best serve the needs of the delivery model, but ultimately there will always be some element of human input to replenish, pick orders and produce.

We also see a shift in labour demand away from the grocery retailers and more towards the “Gig Economy.” Masses of cyclists in their branded kit roam around city centres delivering everything from a latte, a burger and chips or cat food!

How will technology help resource the gig economy more effectively? Will the future see masses of delivery bots bringing our every whim to our front door or drones in the sky dropping food to drop spots!?

Well, based on the evolution of the retail industry in the last 20 years, anything is possible! Back then, I would never have imagined that our reality would be HD movies on our phones and much more! I also never imagined that we could use Artificial Intelligence and Machine Learning to make the days of scheduling teams in Excel to put an A4 print on the wall a distant memory!

So, what steps are you taking to give your business the edge during these challenging times? Those who embrace technology to standardize their labour strategy can reduce variability across the business of new or less skilled managers, making sure your sites are resourced effectively and reducing costs by making sure the front-line workforce is available where and when they are needed. Your business is better positioned to serve your customers, giving them good service but great value for money.

Suppose there are ways to save on your highest cost – labour – by getting your schedule forecast as accurate as possible? This enables you to invest or re-direct cash to other business areas to create stability, increase wages, plug skills gaps or offer your customers better value for money by protecting them from all the operational cost increases.

The great news is that in 2022, technology can help businesses get the right people in the right place, doing the right thing, at the right time in the right way! With the rising costs of doing business biting in every aspect, this is more important now than it has ever been.

Harnessing this technology can help offset some of the additional costs. Right now, we are all facing an increase in daily living costs. This also affects businesses, which means that some key areas should be on the minds of business leaders. There is only so much money, and the increasing costs need to be passed onto the consumer at some point. Therefore, any opportunities for savings may give the competitive edge! Many businesses start their workforce management / labour optimisation journey and lose steam after the first couple of years. Maybe they don’t revisit their original labour standards, maybe they handover the management of these to a finance representative to save money, or it maybe something else that leads them away from a structured  way to create their labour plans.

It is commonplace that businesses try to make incremental improvements themselves, giving a handful of people the responsibility. The reality of this strategy is that there are savings in cost, but the impact is limited. The reason, simply because there is only so much you can do using traditional tools and with limited resource. Those who are serious about standardising their labour strategy will turn to technology, knowing that leveraging this powerful tool will automate and standardise many of the aspects that make it impossible to effectively implement changes at a company level using a relatively small team of people.

Fall is one of the busiest times of year; school is in session, football is in full swing and fall festivals are bustling. For many retailers, there is little rest beyond the extra hour of sleep received on the Sunday morning of “fall back.” However, this does not mean that workforce planning habits need to slide with the hustle and bustle of autumn as we transition into winter—or indeed any season. Instead, what if retailers took systematic approaches to workforce planning upkeep all year round, setting them up for seamless success, season after season? It is possible! Let us take a look at three areas where this makes a huge difference: store organization, labor standards and forecasting/scheduling.

Store organization

First, retailer leaders can focus on evaluating store organization, particularly because of its huge impact on labor standards and operational processes. One arena that tends to slip in store organization is ensuring that 5-S standards are maintained. Remember that a vibrant, healthy store is founded on effective organization; this leads to visibility in best practices; best practices predate effective standards; this subsequently drives labor hours and ultimately supports effective forecasting, staffing and scheduling. That is a big deal!

We have found that the most opportune mechanism for ensuring 5-S maintenance is through a Store Champion. Store Champions are voted by leadership to become gatekeepers for all things 5-S related in a particular store. The individual maintains a watchful eye and holds peers accountable to organizational expectations in service of continuous improvement. Store Champions make a huge difference in not only a store’s best practices, but also cultural development of excellence within the staff itself.

Labor standards

Back in February of this year, my colleague and Logile’s VP of Retail Service Brian Monaco wrote an excellent blog article called Notice to Update: The Labor Management Checklist. It was about things to consider while maintaining an organization’s labor model. This information fits aptly into today’s post. Retail engineers can regularly review operations to determine the appropriateness of labor standards. Like 5-S, great labor standards impact everything beyond it, including forecasting, staffing and scheduling.

This can be implemented in a myriad number of ways. One way is for store personnel to monthly or quarterly voice updates to equipment and processes that might impact their labor responsibilities. Engineers then review standards and contemplate expected changes; they can hypothesize financial effects using what-if scenarios around changing labor operations. If these types of checks are done regularly, retail leadership is given power to make operational decisions that benefit everyone in the organization.

Forecasting and scheduling

With organization and standards outlined, let us talk forecasting/scheduling. This begins with regular analyses and comparison around feeder variables in the scheduling system to identify opportunity areas. Store leaders can look at projection versus forecast versus actual versus earned values in a variety of ways. These metrics can be defined as follows:

  1. Projection: system-generated predictor variables, like sales, volume, etc.
  2. Forecast: projection variables plus edits by store/user
  3. Actual: real, measured values for each variable
  4. Earned: the amount of labor used in each area given actual values

Retail leaders can gain profitable data by comparing projection/forecast variables with actual values. For instance, if store projections are more accurate, why are stores making edits? Can they be better equipped to know when edits should be made? If forecasts are more accurate, what can be done to improve the projections? Are there enough tags for outliers? Is the best algorithm being chosen? These are only a few questions to consider.

Conclusion

In concluding, workforce management requires regular upkeep. Without question, the best retailers utilize systematic checks to keep their organization, standards and scheduling at peak performance. This blog post outlined some ideas on how to do that, but it is by no means exhaustive. For more information on how to make workforce optimization the norm, bring in external consultation for guidance. Regardless, keep tabs on your workforce systems so that they are working for you versus against you. That’s how we see falling forward, for year-round success!

One of the largest retail expenses is labor efficiency. Companies employ various strategies to improve their labor rate for this reason. To perform at an optimum labor efficiency rate, retailers place equipment and tools within the work environment to maximize their workforce output. In my experience, some organizations do not have the right tools in place, while other organizations have what they need, but their organizational or maintenance tactics are so loose that they burn money on stalled production. Today’s blog post will review the effects of great equipment maintenance and organization, as well as how this affects workforce labor efficiency, through a topic called lean.

For those of you unfamiliar with this arena, lean comes from six sigma terminology and is focused on reducing waste in the workplace to ultimately reduce variation within production. For the most part, six sigma (which is the reduced variation piece) has been most effective in the manufacturing industry. The good news for those not in manufacturing is that lean (the reduced waste piece) can apply to any industry including retail. Within this blog post, going lean will refer to storing and managing tools effectively so employees know where to find what they need for every step of each process, even if the employee is new. More than that, going lean includes reducing unnecessary steps within the process that cost retailers money. Let us begin.

Get the right equipment in place first

No matter how skilled associates may be, they cannot execute at maximum output if the retailer lacks essential equipment or tools to do the work required. This is especially true when overall resources are compared to the number of employees who need to use them within each task. By providing associates with enough resources to get their jobs done, the retailer’s bottom line is positively affected, and the additional tools eventually pay for themselves. How does a retailer know if they have the right tools in place? First and foremost, a retailer must understand their processes, or standards. What does every step of every task require? To find out, many companies use engineers skilled in time and measure studies to lay out these standards across departments.

Store the tools in the same place every time

Inadequate storage of work materials is another factor that can impact labor efficiency. With poor equipment organization, retailers risk damaging tools or, at minimum, increasing wear and tear. Sure, some items are larger and therefore harder to lose, but if there are no preferred methods for storing smaller equipment, they often get lost. In some industries, like aviation, losing small parts in dangerous spaces (called Foreign Object Debris) can cost billions. In retail, keeping equipment in the same, well-defined, properly labeled space every time saves money in part replacements and labor efficiency. How does a retailer do that? Consultants and engineers often utilize a system called 5-S for this endeavor. Adapted from the Toyota company, the 5-S system stands for: sort, set in order, shine, standardize, and sustain.

Maintain the tools to increase safety and reduce costs

Regular maintenance of equipment is another factor that can have a positive impact on labor efficiency in the workforce. Maintenance often covers activities including inspection, testing, replacement and adjustment of tools necessary for the workforce. Maintenance plays a vital role in reducing the risk associated with workplace hazards and providing safer and healthier working conditions. Additionally, systems like visual method sheets show associates how to use tools properly, lessening the wear-and-tear on equipment and reducing maintenance. Those same visual aids can alert the right people when maintenance is due because they function as tracking mechanisms.

The indirect effect of going lean

Beyond the direct impact that proper equipment, maintenance and storage have on productivity and efficiency, there is an impact on associates’ morale which must be considered. When associates’ tools are organized and maintained effectively, it shows that leadership cares about them. Their morale increases, propelling them forward to do their jobs most effectively. This can cause a retail culture to unify around the vision and mission of the organization. Employees showcase passion for their work, and the result is more corporate energy to get jobs done, thus driving costs down.

What to do next

For these reasons, we encourage retailers to consider going lean through proper equipment maintenance and storage. The first step is to understand all the tasks that are expected from associates day to day. Many companies offer services to help in this standards development process. Next, with an understanding of the work, retailers can determine what tools are needed to perform to standard. Maybe existing tools will do the trick, but maybe updated equipment is needed to effectively compete with other retailers or to adequately meet customer demands. Once tools are procured, figuring out how to store and maintain those tools in a way that makes sense to employees who use them, keeping them safe and effective, will boost a retailer’s labor efficiency.

For retailers beyond these points, continue going lean. Consider storing only what is needed, organizing and upgrading equipment in an intuitive way, and creating guides for others that explain how and why standards are set like they are. Often, retailers do not have to spend significant capital to get more organized, but can do so in a piecemeal fashion over time. Regardless of the approach, going lean will reap dividends for any organization willing to take it on.

In part 1 of this series on managing labor and retail reporting, we examined five common approaches to setting labor expectations. To recap, these include: Wage Percent, Sales per Labor Hour (SPLH), Fixed and Variable Factors, Dynamic Standards-Based Earned Hours, and Labor Task-Based Earned Hours With Production Planning.

Today we turn our attention to the second half of the equation: effective retail reports. Whatever your approach to setting labor expectations, give some thought to how, why and what you need to capture. We’ve compiled some tips and key reporting considerations below to give you a good start in bolstering your reporting game and to help you improve performance and analysis!

No time like the present: Reporting data in a timely manner

After you define and clearly communicate your labor goals, it goes without saying that you’ll need visibility into your stores’ performance against those goals. Here, timing is everything. Week-in-progress reporting is best, because this cadence enables your managers to make modifications proactively during the week, before it’s too late to adjust for events that affect sales. These impacting events may be the result of poorly accepted advertising/merchandising for the current week, or new competitor ads, or weather impacts and so on. Whatever the reason, week-in-progress reporting is essential so that labor can be adjusted as necessary, before the week is complete.

It is also imperative to receive and review reporting within a day or two once final data is submitted and processed. Getting information that is late or outdated doesn’t allow adequate time or insights for your managers to incorporate labor adjustments into upcoming scheduling. The old expression, “How do you eat an elephant? One bite at a time!” is true. In other words, managing in progressive, bite-sized steps streamlines and simplifies the process. It’s a lot easier if you have the visibility to identify an overspend of 40 hours by Wednesday morning—and can therefore remove 10 hours a day for the next four days ending on Saturday—than it is trying to remove 40 hours all on Saturday, the busiest day of the week. The same lesson applies to timely reporting for period, quarterly or year-to-date performance management: Time is of the essence.

Earned hours and earned hours variance should be a key reporting metric

No matter which of the five goal-setting approaches you use, reporting on the variance between earned vs. actual hours and calculating an “Earned Ratio” (ER) Percent is important in order to identify and understand over-achievers and under-achievers. Earned Hours Percent (or ER Percent) is calculated as follows: Earned Hours ÷ Actual Hours x 100 = Earned Hours Percent. It helps to remember that Earned Hours are simply the hours calculated using one of your approaches to labor.

Let’s illustrate with some examples to help understand the calculated ER Percent. Ideally, the goal for all stores and all departments is to achieve an Earned Hours Percent of 100 percent. This means that the Actual Hours are the same as the Earned Hours. If Earned Hours are 100 and Actual Hours are 100, the ER Percent is 100 percent. If Earned Hours are 85 and Actual Hours are 100, the ER Percent is 85 percent, or 15 percent below the goal of 100 percent. If Earned Hours are 100 and Actual Hours are 85, the ER Percent is 118 percent. Interestingly, an ER Percent that falls too far below goal or too far above goal are equally concerning. We’ll see why below.

What are the concerns with stores and/or departments achieving either too far above or below goal?

While on first thought it might seem logical to praise a store or department for achieving a much higher percentage above goal and “being so productive,” in reality being too far above the ideal 100 percent ER could be an indication that assigned tasks are not being completed. These might include critical tasks required to meet operational or food safety standards, merchandising standards, or—equally critical—tasks tied to delivering great service to your customers. A high variance may indicate that shortcuts are being taken, which could have longer-term effects on your business.

Conversely, being too far below a 100 percent ER could be a direct indication of poor performance and employees not having clear task lists or direction to complete those tasks in a timely manner. It may also be that the Earned Hours for that week did not take into consideration additional tasks that may have been required to be completed in that week. These unconsidered tasks might include things like a deep cleaning cycle or additional efforts to support a special promotion. This could have required additional labor in merchandising setup or even additional training hours required for special initiatives. Many things can come into play in both high and low ER percentages, but in either case, the situation warrants investigation.

Considerations on key reporting elements and types of reports

Reports should include the ability to look at a single entity across multiple weeks of time.

We recommend including at least 12 individual weeks. This type of report and time horizon help to identify trends, and the data across the 12 weeks gives insight into whether there is positive progress or negative progress on the set goals. This is particularly so regarding performance toward achieving 100 percent Earned Hours.

Another useful report view should include examining all stores across a single point in time, whether it’s by week, period, quarter, or year to date.

This kind of reporting allows all stores to be assessed in one view by each department. This data provides a solid view to identify and address over- and under-performance on the Earned Hours Percent (ER Percent). While a single week may be an anomaly, viewing performance by the period, quarter, and year to date can help to bring insight into a store or department’s longer-term ER Percent goals.

Ideally, many reports should include the name of the store manager, and in some cases the district manager as well. This enforces accountability for goals and achievements, and it provides direct ownership.

Additionally, reports should be available for metrics ranking across stores. The ability to identify top performers as well as bottom performers can be a powerful tool in labor management. Having this reporting capability either in-house or provided by your workforce management partner can be essential to measuring and improving the labor management process.

Ranking reports are powerful tools to motivate performance and prioritize support efforts.

To really do justice as a valuable tool, ranking report functionality should include the ability to drill into lower-level store data. As an example, viewing and sorting a ranking report by ER Percent enables you to quickly focus on those stores performing too high and also those performing too low. In a ranking report, you select the store you want to assess and drill down to that store’s department-level data. You are then able to review which departments have the greatest effect on the outcome of the ER Percent or other metrics you are reviewing.

To sum it up

In this two-part series, we’ve seen that the ability to define and support your desired approach to labor management along with the flexibility to adapt are very important first steps. We also hit on some key considerations that can help you take your current processes to the next stage. These include gaining and retaining timely visibility into key performance metrics, and ensuring you are measuring and analyzing important indicators that deliver clues into how you are tracking toward your goals.

With the right information at the right time, you can confidently report on progress and proactively course-correct as needed to redirect efforts. As they say, information is power, and that power is within your reach to zero in on and improve labor management performance across the board.

Labor expense is the largest controllable cost to any retail business. As such, managing labor costs effectively is paramount to getting the most out of your limited labor resources. Full-circle management also extends to the ability to produce effective retail reporting that provides critical visibility for proactive course correction and/or to commend those achieving their goals. Visibility is power, as you can’t measure or analyze what you don’t know.

While labor management and reporting are complex functions, it helps to break down some of the elements to understand how they work and where they fit within a retail organization’s operations. In this series, we’ll take a look at common labor management approaches, and in part 2, we will explore key approaches to KPI reporting to support goal achievement.

Let’s start by examining five typical approaches to measuring labor performance and goals: Wage Percent, Sales per Labor Hour (SPLH), Fixed and Variable Factors, Dynamic Standards-Based Earned Hours, and Labor Task-Based Earned Hours With Production Planning.

#1: Wage Percent (Sales ÷ Wage $ = Wage %), also known as Labor Percent

This is typically a more finance department-set metric than an operations department-set metric. Why do I call this a finance metric versus an operations metric? It’s because this metric is purely dollars-based, whereby the hours are driven by the wage rate versus real work content. Although it may serve the finance department well enough, the company operations department is left with hours as an afterthought based on the wage rate applied. Unless a second approach to managing the hours needed to perform the work is also factored in, stores can be left with the burden of trying to achieve the labor percent goal without first deriving the hours needed to both meet store operational needs and to properly serve customers. In this approach, work content isn’t necessarily considered, and payroll associated with overtime and premium rates will be very impactful even if they cannot be avoided.

#2: Sale per Hour (Sales ÷ Hours = SPH), also known as SPLH or Sales per Labor Hour

This is a very typical retail industry metric that is used by companies both big and small. It typically has no variability factored in for high sales weeks versus low sales weeks. Fixed hours are not protected in this metric, and all hours become variable based on sales. Stores that are trying to meet this goal consistently week after week, struggle on the low sales weeks and have an easier time making that goal on the high sales weeks. Much of this is related to the fixed hours.

The biggest concern is that customers are not being serviced properly in the low sales weeks, and employees are less productive on the high sales weeks. Additionally, the SPH approach does not work well with inflation, deflation or promotions that create volatility in the price per item. Likewise, changes in product mix that impact labor content are also masked. Many of these issues arise in holiday weeks. And organizations too often make the mistake of imposing goals across stores when the work content is very different store to store. So, while SPH is a common industry approach to deriving hours, it has considerable drawbacks versus other approaches to labor.

#3: Fixed and Variable Factors

This is a better choice for deriving hours. Variable hours go up or down based on the change in sales. Fixed hours always stay the same and would only change if fixed activities change.

One major difference between the SPH approach versus Fixed and Variable is because variable hours are earned differently based on the sales change for each individual week. The variable hours earned in each week allows the same Items per Hour and Customers per Hour to be consistent even though the sales are very different. This means that the processing time and customer service-level time are held to a constant standard. For these reasons, this approach is a better method than the SPH approach, which doesn’t allow for variability. Note that this process as well as the SPH still requires management of employee rates and overtime to deliver any labor percent goal that may be set.

#4: Dynamic Standards-Based Earned Hours

This is a best-practice approach. It requires either your own labor management team that is fully trained in a standards-based system and trained in creating and maintaining standards, or it requires support from a workforce management company with trained industrial engineers to do the required standards building.

A labor standard is the amount of time expected to complete a task by an average person at an average rate of speed. Standards quite often require specific store information or store characteristics applied to the standard. The number of steps or footage from one point to another is a common characteristic that would be applied. Other unique store information may be the type of equipment used in a specific process. Standards are applied to many information types, such as items—either at the UPC or category level—customers, transaction types and so on.

Hours planned and earned by department completely support work content and are driven by cases, items, customers and other volume drivers; not just sales.

#5: Labor Task-Based Earned Hours With Production Planning

Although I’ve listed Dynamic Standards-Based Earned Hours as a best practice, Labor Task-Based Earned Hours With Production Planning takes things to the next level of program sophistication. It combines standards-based earned hours with labor task-level work planning. This provides your employees with a clear list of work activities that you provide, so they know exactly what is expected, what the tasks are that have been assigned, and when they should be completed. Also, this process includes production planning along with dynamic week-in-progress replanning as sales and sales expectations change.

Imagine your employees coming to work knowing all of the work tasks ahead of them. And not only knowing the tasks that they must perform, but also—if they are in a production department—having a clear list of what products to make, how much to make, and when to make them. Full production planning would also include packaging, labeling, scaling and stocking. With all employees assigned their particular tasks, the process can efficiently run through the full production cycle.

Wrapping it up

As we’ve seen, there are several approaches that can be used to set retail labor goals and manage performance, each with their own implications, uses and levels of sophistication. The first step is to determine an approach to managing labor that will yield the best results for your organization. Once you’ve outlined your labor approach, accurate reporting on your metrics is essential. We’ll cover that in part 2 of this Setting Labor Expectations and Effective Retail Reporting series. Stay tuned!

No one will disagree that higher labor costs are here to stay for retailers. There are many contributing factors: aging baby boomers, competition for retail workers between employers, elimination of high-hour “almost full-time” part-time jobs that don’t trigger full-time benefits, etc. A constant search for new employees and the expectation of regular training and turnover is now the new normal across almost every market in the US. New regulatory requirements around predictive scheduling with employee expectations of better work-life balance have added new requirements for store labor planning and associate retention efforts.

This new normal of higher labor costs has driven fundamental changes in retail organizations as the add-on labor costs have resulted in fewer, less-experienced associates having to deliver the service and format of their retail brand. We see these changes impacting staffing at both the store and corporate offices. Concurrent with these trends on the cost of labor are significant changes in what defines success at retail, including initiatives to extend multichannel shopping, pickup and delivery options to customers. Grocers are challenged to further differentiate perishable departments as defining signature elements of each store—and the company brand collectively. Specialty retail differentiation is also undergoing rapid reinvention to defend the brick-and-mortar store shopping experience from diverse online competitors.

In response, many businesses have applied lean approaches to curtail or discontinue low-value programs or activities in order to redeploy labor to higher-profile customer activities. We also note that corporate staffs have been cut back to reduce overhead and fund new customer-facing initiatives in a push to protect or build top-line sales growth. Labor management teams, for example, are leaner than ever and must rely on system automation and exceptions rather than old-style reporting and analysts’ work. Suffice it to say that all aspects of the business are under renewed scrutiny to drive efficiencies and maintain profitability against these headwinds of change.

This post will touch on some of the biggest impacts of this environment on retail organizations. I’ll leave out the evolution of workforce management technology, store format and facility design for another discussion.

New demands on managers and human resources

If the old-school definition of a store manager was someone who could “get it done” using whatever top-down style they were exposed to coming up through the ranks, newer managers have more considerations to manage with a less-experienced and constantly changing workforce to execute their duties. Some of these expanded considerations include greater regulatory compliance for food safety or other business imperatives, more detailed brand expectations for store conditions, and multiple execution layers associated with promotional activities to engage customers. As such, today’s managers must be better communicators, trainers and coaches to their associates in order to carry these imperatives to successful completion within their stores. Accomplishing this with less-experienced employees who have ample job opportunities elsewhere requires managers to be constantly working on engaging and motivating associates to both meet objectives and get the right things done, in the right way. These managers are the orchestrators of change management and team alignment, albeit with a constantly evolving playbook.

Along with their partners in human resources, store managers also face the need for constant recruiting, onboarding and training to an extent not seen in prior years. Some organizations offer higher wage rates, employee discounts, scholarship opportunities and a variety of other perks to combat turnover, but the common thread for every form of retail boils down to more time and effort expended on employee acquisition, onboarding and training.

A new mandate for centralization and outsourcing

While consumers expect more for their hard-earned dollars—including a memorable shopping experience—labor-intensive elements of store operations have come under increased scrutiny. This is especially true in grocery retailing, where fresh-prepared food offerings require consistent execution from day to day and across stores within a retail banner. If your local store offers true scratch bakery, I suggest you enjoy it while you can. Retailers have been caught in the challenge of staffing these departments and producing consistent products with fewer trained or trainable workers than ever before. And while innovation on the product side has brought us mix and bake, bake off or frozen/shelf-ready products with longer shelf life, these options cannot fully replace the taste, theater or scents of a true scratch operation. Many choose to focus on a handful of orchestrated items and supplement with alternatives.

Prepared foods and kitchen functions are similarly facing attrition given the complexity of worker training over a shorter employee job span. Centralized kitchens or outsourced prepared or partially prepared foods make for easier execution in stores without the small-batch cooking processes normally associated with competing restaurant culinary options. As the challenge to execute consistently at the store level becomes more problematic, offerings are often pared down to the items that are the easiest to execute with reduced worker training. Innovation in robotic food preparation may eventually help in some areas, but the imperative is to align your offerings to what you can execute with the workforce you expect to have.

Not every retailer is trimming away these offerings completely, but most are evaluating which components might be reconsidered based on the volume, performance and the associate skills required to successfully execute.

Focus on simplified execution in stores

Every company we talk with is reviewing store labor models and task frequencies in search of low-value activities to eliminate in order to free resources for higher-value customer-facing activities. This critical exercise not only drives shopper engagement across every business channel but also helps to defend and build topline sales. 

Work simplification (what gets done), process simplification (how it gets done), and workplace design and organization (facility design and automation supporting process execution) are new targets for incremental optimization. More companies are looking to outside consulting firms for guidance and innovation in this realm and are streaming continuous improvement initiatives back to the stores. The best of these also focus on what stores need to stop doing, so the mission of store associates is truly streamlined and not just buried in new layers of add-on expectations.

Many of these initiatives are moving to stores with less support from leaner labor management teams and without structured training and deployment guidance. Store management teams must sort it out, communicate it, and adapt scheduling and performance expectations to deliver the package. Often managers are still left feeling they are building a second story on a house while the foundation is being built or rebuilt.

Encouraging employee retention and development

The cost of employee turnover has never been higher, and the best companies and managers are working harder to retain and develop people to fight turnover. Whether driven by state or local regulations or by proactive company policies, most companies are making efforts to accommodate associate availability and schedules to allow for more consistent schedules and better work-life balance for their people. 

Some companies are also doing more to assess associate skills and potential and to map development plans to retain the best employees and prepare them for next-level opportunities. Often this also serves to create better cross-utilization of associates. Given the high cost of acquiring, onboarding and training new associates, who can afford not to develop the best prospects already within the organization?

Automation and optimization in store systems

If there is a bright spot of opportunity, it is introducing next-generation technology and artificial intelligence (AI) assistance to simplify and streamline store execution. New checkout options offer the ability to meet customer expectations with fewer cashiers, while robotics experiments are becoming more common for tasks like floor cleaning, aisle inspection and out-of-stock replenishment identification. Smarter systems offer optimization potential for production planning, inventory management, and the systematic adherence to food safety requirements and log reporting in all food production areas. Workforce management systems can now produce more accurate forecasts and truly automate wall-to-wall scheduling. These welcome advancements replace the complex manual jigsaw puzzle that managers face in matching workplans and customer service needs to associate skills and availability. For the early adaptors, these improvements have all resulted in the effective redeployment of management time to associate coaching and on-floor activities that engage customers and drive sales.

Closing thoughts

Rising labor costs associated with wage growth, fierce competition for qualified associates, higher turnover, and other related issues represent the new normal. Meanwhile, competitive pressures continue to change the store’s mission and focus.

We see the store as the last frontier of optimization. That’s an exciting opportunity for reinvention and differentiation! However, actualizing this potential requires savvy change management and the effective automation of processes, systems and tasks that free managers to prepare and motivate their people. This sets everyone up to execute consistently and successfully deliver on your unique brand promise. 

Those organizations who do this best will be most likely to reap the significant rewards.

In the ideal retail situation, labor analysts can focus their attention on data interpretation, allowing their information technology to do heavy data mining. Alas, this is rare. Many labor teams require analysts to gather and shape data prior to analysis. In the worst-case scenarios, retailers have understaffed or non-existent labor teams to complete these tasks. I empathize with retailers in this struggle. When analysts are required to gather and shape data during workforce management (WFM), they are less effective than their competitors for several reasons.

Data analysis detriments

First, this combination leaves room for human error in a complex array of workflows, from work measurement to scheduling effectiveness. Second, the necessary data massaging that occurs prior to interpretation takes considerable time, providing analysts with less energy and capacity to focus on fine-tuning the details that matter in getting schedules to stores. Third, the extra time to send important information to store managers and employees leaves associates at a disadvantage as they rush to implement labor plans, ultimately dissatisfying customers and benefiting competitors.

This scenario certainly varies from our ideal. However, there can be a bright and hopeful future on the horizon if retailers consider a shift from data to systems thinking. Systems thinking involves the utilization of tools offering wall-to-wall labor management and implementation capabilities. For analysts who use systems thinking and analysis, data is at their fingertips to be arranged, rearranged and configured for actionable review. Analysts can quickly see issues and call them to leadership’s attention.

Systems thinking overview

The shift to systems analysis requires a technology investment, but it includes a significant return. Research shows that putting the right people in the right place doing the right things at the right time causes a ripple effect of organizational productivity and profits. However, few WFM solutions do this well. Retail customers expect an excellent experience that includes stores with a lovely atmosphere, stocked shelves and on-cue service. Organizations that can accomplish this will lead the industry. Investing in technology that offers retail leaders time to focus on the important things is imperative.

This can be done by ensuring WFM tools are calibrated in a way to catch outliers so that analysts can understand them and make decisions based on that information. The best WFM systems pull the data together, while the labor team summarizes information to help managers lead the business. Many best-in-class WFM tools are intuitive and self-learning, leading to more accurate plans, forecasts and schedules every week. This allows small labor teams to transition their focus from wrestling with data to more value-added pursuits, like fine-tuning the system, training store users or instilling best practices into standard operating procedures.

The optimal labor management journey

Let’s take a walk through the labor management journey to see how a great WFM system will aid labor analysts along each step of the way.

Work standards and forecasting

A wall-to-wall WFM system starts by providing actionable checks and information updates to labor analysts. Beginning with work standards, operating procedures and labor goals, the system should include effective-dating and data flow checks. Afterwards, the system should forecast at every business level and allow the retailer to differentiate between versions. A great forecast is built from the lowest tier and checked upward for accuracy. Here, the system can also monitor data set points and proactively notify analysts around potential issues.

I have heard retail gurus talk about forecasting as the cornerstone to effective, wall-to-wall store planning; thus, systems thinking in this space is monumental for labor teams. Some WFM systems let users make edits to system-generated forecasts, but few use automated technology to feed those edits back into the system, allowing it to learn from its mistakes and get smarter. It is important that labor teams have visibility into the accuracy of each forecast. The more instinctive the system, the fewer edits the labor team makes over time.

To summarize, a world-class WFM system will include the following functionality for work standards and forecasting:

  1. Standards and labor model transparency
  2. Forecast version control
  3. Quantifiable forecast accuracy
  4. Anomaly identification
  5. Automated system learning

Staffing

With work requirements and a great forecast, the system workflow moves onto creating staffing demand. A very complex but necessary step is to ensure labor requirements and service standards match. This is instrumental in labor management; does your WFM system create staffing demand? The system must compare staffing requirements against work requirements to ensure no gaps exist. If a gap is present, a great WFM system will provide actionable details around necessary changes. This ensures things like minimum coverage and safety valves (as a part of queue management) are in place to meet service expectations.

Scheduling

As a final step, WFM systems use staffing demand to create optimized schedules by building shifts covering work requirements and employee constraints. The best schedules utilize task-based workload planning. A labor team wastes time writing schedules that a WFM system can provide automatically. The system covers all work requirements, staffing necessities and scheduling rules and directives. If a retailer’s WFM system is self-learning, schedules become more and more accurate over time. For a small labor team, this sounds dreamy!

Wrapping up

In conclusion, where gathering and shaping data was necessary in days past, machine learning WFM systems now provide the mining work for labor analysts. I have seen this work first-hand and believe in its effectiveness. Retail is a small-margin business, making any competitive advantage important. Thus, moving from a data to systems analytical perspective with the right tools could lead a retail business into greater profits.

Every few months, I receive a notice to update the software on my smartphone. I make sure to prioritize those updates, uploading them as quickly as possible. Without a current operating system, my phone becomes useless. Labor management is similar. In this analogy, the cellphone symbolizes labor standards, while the update represents characteristics, frequencies, standard operating procedures (SOPs), volumes and more. The standards and their resultant workload output are only as good as the data driving them.

This blog is your notice to update, offering a labor management checklist with reminders for labor analysts, engineers and managers to ensure regularly updated labor data. It is not holistic, and might vary by operator, but the goal is to stimulate thinking. The first technology-based question on the checklist is: are you updating your volume driver data annually? If not, it may cause repeated adjustments to forecasts and earned hours each week. Yearly updates might center around a Pareto analysis, which ranks standards by most impactful to least.

Additionally, information technology (IT) is updated regularly across organizations and this can happen quickly throughout the year. Are you tracking how IT revisions affect labor standards? To keep the labor model accurate, labor engineers must understand how these technology changes affect standards, operations and sub-operations. Processing times within standards should be reviewed for correctness based on how system changes disturb daily work routines in stores.

Let us move from technology to operations on the checklist. Question three is: do you know the top five methods in each store department? A methods analysis can help alert operators to process updates needed in labor standards. The analysis can also help identify operations and sub-operations that lack value. The common business adage is what gets measured, gets managed. Taking that one step further, it is important in labor management to remember that what gets measured consistently can be managed effectively.

Fourth, where and how are your employees spending their time? This question is particularly important for specialty retailers, but also impactful for grocery and big box retailers. A tool used often by our engineers is called a utilization study. Engineers track associates across a variety of operations to understand what the labor force is doing. This provides opportunities for associate coaching, standards improvement, service examination and more.

Fifth and importantly, does your organization align SOPs with labor standards? Many companies create and manage SOPs in category management versus labor engineering departments. Creating close working relationships between the two departments can prevent mishaps. Before SOP changes are sent to stores, labor engineers can approve each document’s finality. Labor engineers can also review SOPs annually to ensure store expectations match up with store allocations.

As a retail manager, I remember issues between SOP changes and model management creating major labor impacts. If standard frequencies changed in the SOP, or if the SOP asked associates to move from daily activities to those less frequent, the time differences multiplied across instances and locations grew quickly. Additionally, if an operation or sub-operation is eliminated altogether, the economies of scale associated were significant. The result was misaligned budgets and performance.

In review, this blog asked five questions to remind labor analysts, engineers or managers how to keep labor models in tip-top shape. Those questions were:

  1. Technologically: are you updating your volume driver data annually?
  2. Technologically: are you tracking how IT revisions affect labor standards?
  3. Operationally: do you know the top five methods in each store department?
  4. Operationally: where and how are your employees spending their time?
  5. Operationally: does your organization align SOPs with standards?

As mentioned, this list is anything but exhaustive. The hope is it can ignite your process of intentionally inquiring about by your organization’s standards upkeep. Labor specialists can ask, measure and track data consistently to maintain the integrity of your labor model. Your bottom line, shareholders and customers will thank you for doing so!

This is Part 4 of a 5 Part series on Forecasting by Dan Bursik. To read Part 3, click here.

In my previous blogs related to effective forecasting I have covered several basic concepts that carry forward into this discussion. Whether you want to consider these as key concepts or catchy phrases, here is a quick summary of those ideas:

You can’t get a good schedule out of a bad forecast.
If there is no right place for the hours to be positioned, then you can’t create a good schedule even with a good forecast.
If you haven’t gotten serious about your best practices, labor standards or labor modeling, you probably have bigger challenges to attend to before forecast accuracy optimization.
The better your data and standards can combine to anticipate the work content of your associate’s work plan, the more important that accurate forecasting will become.
Your ultimate objective is to put the right people in the right place at the right time doing the right things.

So if you are at a point where forecast accuracy matters in the correct placement of hours, what is the best way to evaluate the accuracy of your forecasts?

Ultimately, there are two ways. The first is to measure the accuracy of the forecast metric itself against the actual value you experience. Produce customers forecast Tuesday versus Produce customers actually served Tuesday. Or, Deli service counter customers forecast from 1:00 to 1:15 Saturday versus the actual number served at that time.

With this approach you may need several tests to assess whether a forecast meets your needs because the time interval you evaluate for accuracy also matters. Take a simple approach to store sales as a metric. If you test weekly accuracy let’s hope you are within 2 percent of what the actual shows. Is that good enough?

Well, it depends.

Since you don’t place labor on the basis of weekly sales, getting that close at the weekly level doesn’t tell the whole story. If every day was within 2 percent then it sure looks better. But let’s say one day was high by a huge margin and another day was low by an equally large miss. In the total they would seem to cancel one another out. But if you allocated labor by the daily work content, would that be good enough? I think not. Tell the customers who were poorly served Wednesday that you spent their service labor Monday and it won’t give anyone cause to applaud. Two wrongs don’t make a right just because you grade it at a higher level.

The point is that if you are evaluating your forecast accuracy at the metric level then you need to be careful that the level you evaluate is appropriate. And just as errors Tuesday don’t cancel out more errors Wednesday, Thursday morning errors don’t cancel out Thursday evening misses either. Make your evaluation at a weekly, a daily, and an interval level for the best insight possible.

So if grading the accuracy of the metric is the first approach, let’s now look at the second. This approach doesn’t look at the metric.

Instead it looks at the hours you calculate from the metric.

Now, again, this approach is only meaningful if you’ve really determined that there are correct places for those hours to be to do the work and to satisfy all service expectations.

If you can say that, then evaluating whether the forecast hours align with the hours earned from the actual metric volumes experienced is the true test of forecast accuracy.

Again, if your goal through labor modeling is to put the right people in the right place at the right time doing the right things, then what matters in forecast accuracy is the degree to which hours get misplaced – put where they are not needed, or absent from where they are needed. The absolute sum of those differences is what your continuous improvement efforts are geared to eliminate.

You can argue that minor variations, especially in task or production labor don’t cause much pain so long as your workforce utilizes the time and gets all the work done. Of course that does not hold true for hours associated with direct customer service.

Is it possible to quantify the delta between your planned hours and your earned hours? It should be, however it is easier in some systems than in others. Your system should capture multiple iterations of your planning process from the original system forecast and scheduling requirements to those impacted by forecasting or scheduling edits by your central labor team or store personnel. Unfortunately, if your system does not capture that original version you may discover that you have plenty of error but you won’t necessarily know if that error came from system algorithms or through various edits made which may have improved or degraded the original system plan.

If you can clearly quantify the deltas it puts you in a great position to assess cause and effect; to consider the use of alternate algorithms or to consider whether special events or tags ought to have been present as a part of your forecast. If you withhold important information from the forecasting process, there is no way any system can anticipate the impact of the event. Like anything in process improvement, it’s an opportunity to trace and explore the root cause issues and to diminish their impact in future week forecasts. That, to me, is continuous improvement in forecast accuracy.

So, to recap, forecast accuracy is about understanding the gaps between what you forecast and what actually happens. You can evaluate forecast accuracy either at the metric level or based on the hours generated from your metric forecast. If you evaluate the metric elements be sure that the time granularity of your analysis gets to the levels that matter. Start with the weekly but be prepared to go to the daily and interval levels if that is where the metric forecast would impact the placement of hours. You can also evaluate the difference between forecast and earned hours. Arguably, this is what matters most. However, if you do this analysis it may lead you back to the metrics to find the root cause issues in the data set you select for forecasting, in the operations used in the algorithms of your forecasting process, or in identifying the historical special events or tags that your system needs to forecast more accurately.

I’ve got one more blog to offer on this topic regarding best practices associated with accurate forecasting and some lessons I’ve learned over the years. Let me share one that should already be clear: managing forecast accuracy for continuous improvement is not an event, but a journey. It’s a key part of putting the right people at the right place at the right time doing the right things to deliver your brand and satisfy your customers.

This is Part 3 of a 5 Part series on Forecasting by Dan Bursik. To read Part 2, click here.

In my last blog I talked about the need for accurate forecasting as a vital link in the chain of your labor management and operational planning and execution strategies. We touched on three important ideas that are helpful to remember:

  1. You can’t get a good schedule out of a bad forecast.
  2. If there is no right place for the hours to be positioned then you cannot create a good schedule even with a good forecast.
  3. If you haven’t gotten serious about your best practices, labor standards or labor modeling, you probably have bigger challenges to attend to before forecast accuracy optimization.

But let’s assume you are working your way through the labor management process and see forecasting as an opportunity. It’s still important to consider what you are forecasting and whether your general approach for forecast data are aligned with your ultimate objective of putting the right people at the right place at the right time doing the right things. As far as I know, that’s the objective and accurate forecasting is a critical means to that end.

So, think about that objective and consider what you are forecasting and how you are forecasting it. This question concerns the granularity of your forecast element (e.g., department items, category items, specific UPC items, etc.), the time granularity of your data (e.g., weekly, daily, 15-minute interval volume, etc.) and the metrics you are using (e.g., sales, items, customers, etc.) to which you are applying your standards.

Let’s consider the labor needs of a Deli service counter. Some businesses use sales as the major (or even the only) forecast metric to quantify business volume. Some will drive it by items, some by customers and some by pounds – all of which can be supported by data at the department, category, sub-category or item levels. In cases where department information is the driver, then the business portion requiring service labor might be a fixed apportionment of the total Deli. If driven at lower levels, this apportionment becomes much more dynamic by day and by time of day.

Let’s use a set of three examples from Deli to illustrate how the right data can capture or mask the underlying work content. Ask yourself if the time is different for each of these scenarios:

  1. One customer purchases 10 lbs. of sliced ham in 1 package.
  2. One customer purchases 10 lbs. of sliced ham but asks for them to be packaged in 10 packages of 1 lb. each.
  3. Ten customers each want 1 lb. of sliced ham.

I hope it is obvious that although each scenario involves selling 10 lbs. of ham or the same dollar value in each case, the work content of these three scenarios is significantly different. To get each of these scenarios reflective of the right amount of labor and attending to your service objectives, three volume drivers need to be present in your forecasting methodology and, preferably, at 15-minute interval time granularity.

  1. Number of customers to serve.
  2. Number of items (packages) to make.
  3. Number of pounds to slice or produce.

So how does your approach to forecasting Deli service counter workload play out through these three examples? Would your approach capture the labor differently in each scenario?

It’s not that you can’t drive it from sales, or simply from items, or from customers or from pounds; it’s just that the best way to do it is to be able to effectively handle all three units of measure dynamically. This makes package size, and order size dynamic by day and by time of day. Is that important? I certainly know retailers who would say emphatically, yes it is.

If you aren’t forecasting at this detailed level, you need to ask how you provide the right service to your customers and how do you schedule the right number of associates at the right time?

Was it that no one thought to ask if such data could be captured? Was it that your POS or scale systems could not provide it? Was it that your labor forecasting and scheduling system couldn’t manage it? Was it a conscious decision or is it one you should revisit? You could spend the same number of hours in a day but if your business expects higher level of business on the evening than morning, you need to make sure you have better coverage in the evening than in the morning and you have a blend of higher skill level associates in the evening than in the morning.

As to data granularity, are you capturing the details at the department level? At the category level? At the UPC level? Is your labor model thoughtfully developed with the right data? Did you inherit what you got and simply accept it or did you really get what you need to model labor effectively? Are you living with what your information technology team agreed to give you instead of what you really need? Or was your data design dumbed down because of functional limitations of your vendors’ solutions? What is the value of taking a fresh look at the data you need to meet your needs today?

Regarding time granularity, are you capturing and using the relevant data on a weekly basis? On a daily basis? Or at a 15-minute interval basis? Is the data granular enough for you to be providing the best service to your customers assuming you can find a way to forecast at that time granularity?

Is the work of a Deli Service Clerk the only place where this sort of challenge occurs; where multiple units of measure are required to get the work content best quantified? No, aside from any other service counter you may have (Meat, Seafood, Bakery, Prepared Foods, Service Center, etc.) the same is true for many other operations.

Cashier workload should best be split into express eligible and not express eligible (with department registers and self-checkout volumes excluded). After that, their workload is a combination of customer interaction and item processing. Some of the customer processing is direct customer interaction – meet, greet and thank time. Other parts of the customer time should be based on the types of tender being processed (e.g., cash, credit with signature, credit without signature, debit, WIC, SNAP, check, etc.). The items then drive processing time by the type of method required (e.g., scan, key entry, weighed and keyed, etc.).

So, I hope those examples illustrate that the data strategy you take into your forecasting approach really matters. The more reflective you data and your standards can combine to anticipate the work content of your associates’ work plans, the more important that accurate forecasting will become. And just how to measure and improve on forecast accuracy will be a topic for our next blog. In the meantime, take a fresh look at your data and consider whether refinements are in order. Consider whether you are capturing all the right units of measure and if you have them at the right level of granularity.

For forecasting to matter most, there has to be a right time, a best time, for hours to be positioned. Once you have that you can put the right people at the right place at the right time doing the right things!