

The last back-to-school endcap comes down, and the work does not pause. In most stores, the same aisle is already being reset for Halloween, and the plan behind it is being written for a quarter that runs through seasonal transitions, holiday peak, and the January reset that follows.
That handoff is the real start of Q4. It is also the moment when a labor plan stops being an annual exercise and becomes a weekly operating decision. Back-to-school is one demand pattern giving way to several overlapping ones, and each of them creates different work in different departments at different hours.
Back-to-school already told you how Q4 will behave
This year’s back-to-school season did not arrive as one spike. The National Retail Federation and Prosper Insights & Analytics reported on July 14, 2026 that 62% of shoppers had already started buying for the school year by early July, and that families with elementary through high school students planned to spend a record $43.3 billion, up from $39.4 billion in 2025.
The behavior underneath that number matters more than the number. Nearly half of shoppers (47%) said they planned to buy only the essentials for the start of school and replenish through the year, 46% of those with shopping left said they were waiting for the best deals, and 54% used June sales events for school purchases. Demand did not disappear after the first week of school; it spread out.
Spread-out demand changes the work. It extends replenishment cycles, keeps basket sizes smaller and trip counts higher, and pushes promotional response into weeks that used to be quiet. If a Q4 plan assumes the season ends when the school year begins, it starts the quarter with the wrong baseline.
Q4 does not start in November
The transition from back-to-school into Halloween is the first real test of a Q4 labor plan, and it is a larger one than it used to be. NRF’s most recent Halloween survey, released in late September 2025, projected record spending of $13.1 billion, up 12.9% from $11.6 billion the prior year, with 49% of consumers starting earlier than normal. NRF releases the current-year Halloween survey in late September, so this year’s figure will land after most stores have already built the plan that has to execute it.
That is the operational point. Seasonal demand keeps moving earlier while the planning calendar stays where it was. By the time the season is confirmed, the schedule is published, the resets are underway, and the store is absorbing the difference.
Seasonal transitions are labor events, not merchandising events
Between late August and the end of December, a typical store runs several transitions in sequence: clear back-to-school, set Halloween, convert Halloween to harvest and Thanksgiving, build the holiday set, then run post-holiday markdowns and returns. Each one creates concentrated, deadline-bound work—resets, floor moves, signage and price changes, backroom staging, and disposition of the outgoing season.
This work rarely shows up in a sales-driven labor forecast, because it is not correlated with the register. It is correlated with the merchandising calendar. When transition work is not planned as workload, it lands on the same associates who are expected to serve customers, and one of the two gives way.
- Translate each transition into hours by task, department, and day, not into a lump-sum project allowance.
- Place the work where it can actually be done—overnight, pre-open, or low-traffic dayparts—rather than assuming it absorbs into the day.
- Identify which roles are qualified to do it, and whether those roles are already committed to service coverage.
- Sequence transitions so that two deadlines do not land on the same store in the same week.
The inventory is arriving before the demand
Supply timing is also shifting the shape of Q4 work. In the Global Port Tracker report released August 7, 2026 by NRF and Hackett Associates, this year’s peak shipping season was described as early and already winding down, with import volume expected to stay high through August before declining for the rest of 2026—NRF’s Jonathan Gold noted that retailers brought merchandise in ahead of late-July tariff changes and that they will be well stocked for the coming holiday season.
Merchandise that lands early has to be received, staged, and held somewhere. That is receiving, backroom, and replenishment workload occurring weeks before the selling weeks it supports. A plan built only on the sales curve will understate labor in September and October and then overstate how quickly stores can flex in November.
Hope that demand behaves like last year is not a plan
Last year’s schedule is useful evidence. It shows prior peaks, familiar friction, and questions worth asking. It is not this year’s labor plan. A prior schedule reflects the demand, assortment, promotion cadence, fulfillment mix, and workforce availability that existed then.
Conditions have already moved. Consumers are shopping earlier and buying in smaller increments, promotional events have multiplied, and inventory is arriving on a different timeline. Meanwhile, demand itself has been steady rather than dramatic: the CNBC/NRF Retail Monitor released August 10, 2026 showed July retail sales up 5.15% year over year and a tenth consecutive month of growth. Steady top-line growth with a changed demand shape is exactly the condition that makes copy-forward scheduling look safe and perform poorly.
Use history as a starting point for investigation. Where did managers edit the schedule most? Which departments needed unplanned support? Where did overtime, service pressure, or task delays appear? Then test whether the drivers behind those patterns still hold.

Start with demand-based labor planning, not the schedule
A schedule is an output. The inputs are demand, the work that demand creates, and the capacity available to do it. Demand-based labor planning means forecasting the drivers that actually move work—traffic, transactions, units, item movement, deliveries, pickup orders, returns—at the store, department, and interval level, then converting that forecast into required work before anyone opens a schedule.
Logile Forecasting produces self-learning forecasts at 15-minute intervals for sales, items, and traffic, and feeds them directly into staffing and execution. That granularity matters in Q4 because the difference between a good and bad week is often an hour: the pickup wave that arrives before the evening rush, or the two hours after a truck lands.
Turn demand into workload before you turn it into hours
Task and workload planning is the step that makes a Q4 plan executable. Labor standards translate forecasted demand into the specific work each department must complete, and add the work that demand does not predict on its own—resets, staging, food safety and fresh production tasks, cycle counts, and compliance routines.
Once the work is visible by department and daypart, the tradeoffs stop being invisible. A workload-based plan can show where a replenishment window must be protected, where service coverage cannot be reduced, and where cross-trained associates can cover a seasonal peak. That is a more useful instruction to a store than “add hours,” because it connects labor investment to the work that has to happen.
Omnichannel work grows fastest when the store is busiest
Pick, substitution handling, staging, curbside handoff, exception resolution, and returns all consume labor without appearing as register activity. In Q4, this workload rises at the same time transition work and service demand rise. If fulfillment is planned separately—or not planned at all—the store looks adequately staffed until associates are pulled off the floor to meet a channel promise.
Plan fulfillment in the same model as the sales floor: what workload each step creates, when it occurs, which roles can perform it, and what it displaces. Then the cost of a channel promise is visible before the schedule absorbs it.
Evaluate workforce capacity before schedules are built
A seasonal labor requirement is not executable simply because it has been calculated. Headcount, availability, skills, cross-training, productive hours, attendance patterns, hiring progress, and manager capacity all determine what a store can deliver in December.
Evaluate capacity while there is still time to act. A gap found in September can be answered with hiring, training, transfers, or an operating change. The same gap found in November becomes an overtime problem and a service problem at the same time.
Test Q4 decisions before they reach the store
Q4 rarely follows one script. Demand can move earlier or later, a promotion can overperform, weather can redirect traffic, and a transition can slip a week. Scenario planning is how teams move from a single optimistic plan to a set of prepared responses.
- Model a baseline alongside plausible higher- and lower-demand cases for each peak week.
- Test the labor impact of promotional timing, extended holiday hours, fulfillment volume, and hiring shortfalls.
- Identify the stores, departments, and intervals with the least capacity to absorb change.
- Decide in advance what triggers action: hiring, cross-training, overtime authorization, or an escalation path.
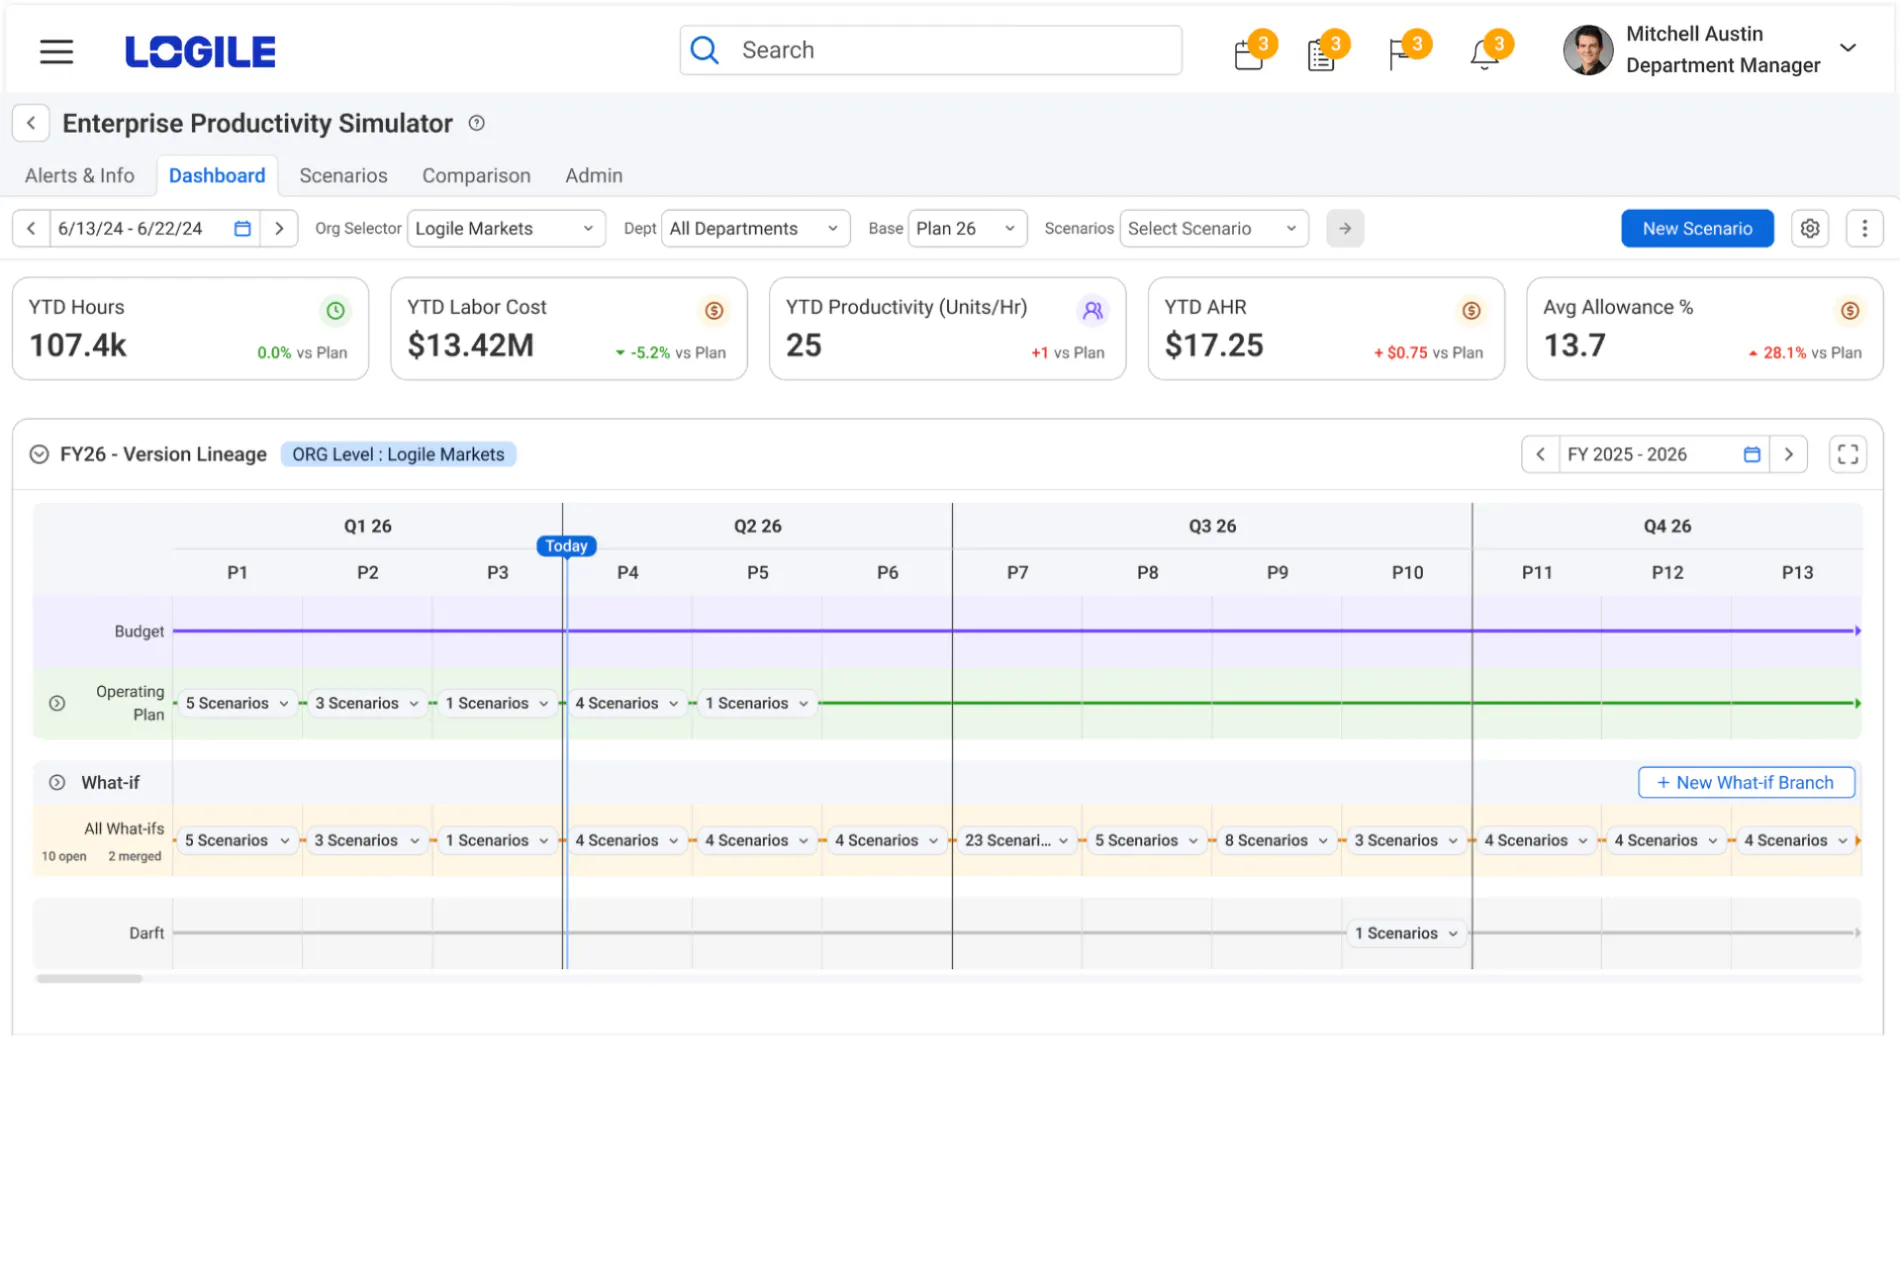
This is the role Logile’s Enterprise Productivity Simulator plays. EPS lets teams simulate workforce, productivity, and operational changes—staffing levels and role deployment, labor standards and operational drivers, forecast and budget assumptions—across stores, clusters, regions, or the whole enterprise before implementation, with governed review and approval. A scenario earns its place in the plan when it would change a decision.
A Q4 planning cadence that fits the quarter
- Now through mid-September: re-baseline demand using this season’s actual behavior, not last year’s curve; load transition work as workload; confirm capacity gaps while hiring and cross-training can still close them.
- Late September through October: lock the Halloween-to-holiday transition sequence, model peak-week scenarios, and align the resulting labor requirement with budget.
- November through December: manage by exception on a weekly cadence—forecast versus actual demand, scheduled versus worked hours, fulfillment volume, overtime, schedule edits, and service signals.
- Late December into January: plan returns, markdowns, the post-holiday reset, and inventory counts as their own workload, and capture what the quarter taught you for FY27 planning.
The point of the cadence is not to chase every fluctuation. It is to recognize a meaningful shift early enough to update the plan before the store absorbs it.
Validated WFM impact metrics (based on Logile Enterprise benchmarks)
- Up to 97% daily forecast accuracy
- ~6% reduction in labor costs
- 25–35% less unplanned overtime
- 30–50% less time spent forecasting and scheduling

Plan the Q4 you will actually operate
Back-to-school is ending, but its demand pattern is still running—and Halloween, the seasonal transitions behind it, and holiday peak are already in the plan, whether or not they are in the model. Treat the rest of the year as a connected sequence of store- and department-level operating demands, plan the workload before the schedule, and test the decisions before they reach the floor.
See how retailers simulate labor decisions before rollout: Logile Enterprise Productivity Simulator. Run Great Stores With Confidence.
Sources
- National Retail Federation and Prosper Insights & Analytics, “Majority of Back-to-School Shoppers Get a Head Start on the Season,” July 14, 2026: nrf.com
- NRF and Hackett Associates Global Port Tracker, “Import Cargo’s Early Peak Season is Winding Down,” August 7, 2026: nrf.com
- CNBC/NRF Retail Monitor, “Retail Monitor Shows 10th Month of Sales Growth in July,” August 10, 2026: nrf.com
- NRF Halloween consumer survey, reported September 29, 2025 (record $13.1 billion, up 12.9% year over year; surveys are released in late September each year): Talk Business & Politics
- Logile Enterprise Productivity Simulator product page: logile.com
Q4 Retail Labor Planning FAQs
Retailers should begin Q4 labor planning early enough to identify workforce capacity gaps before peak demand arrives. Planning should account for expected sales and traffic, promotional calendars, fulfillment demand, operating hours, hiring needs, employee availability, skills and other workload drivers. Starting early gives teams more options to hire, cross-train, adjust staffing strategies and test different demand scenarios before stores enter their busiest periods.
Q4 demand does not increase evenly across every store, department, channel or daypart. Promotions, holiday shopping patterns, online fulfillment, returns, replenishment and extended operating hours can create different types of work at different times. Effective Q4 labor planning determines where and when work will occur and what skills are required rather than applying a uniform increase in labor hours.
Retailers should include the workload created by digital orders alongside traditional store demand. Picking, substitutions, staging, curbside or in-store handoff, exceptions and returns all require labor even when that work is not reflected in checkout traffic. Incorporating fulfillment forecasts into labor requirements helps retailers avoid forcing store teams to choose between digital fulfillment and customer-facing work during peak periods.
Retailers can develop multiple demand and labor scenarios before peak season and establish indicators that signal when the operating plan needs to change. Comparing forecasts with actual sales, transactions, fulfillment volume, worked hours, overtime, schedule changes and service levels can help teams identify meaningful variance early enough to adjust staffing or workload plans.
Retailers should evaluate more than total headcount. Q4 capacity planning should consider employee availability, productive hours, role and skill coverage, cross-training, planned absences, hiring progress, attrition and coverage during critical intervals. A store may have enough employees overall while still lacking the right skills or availability during its highest-demand periods.
Promotions can change both the amount and timing of store workload. Retailers should evaluate how individual events may affect traffic, transactions, item movement, replenishment, fulfillment and customer service requirements by location and department. Labor plans can then be adjusted around the work each promotion is expected to create instead of relying only on historical sales or broad seasonal assumptions.
Useful Q4 indicators can include forecast versus actual demand, scheduled versus worked hours, overtime, fulfillment volume, schedule edits, coverage gaps and customer-service or execution measures. Looking at these signals together can help retailers determine whether labor plans remain aligned with changing store conditions and where intervention may be necessary.
Put Your Q4 Labor Plan to the Test
Q4 rarely unfolds exactly as expected. Promotions can outperform forecasts, fulfillment demand can shift, hiring can fall behind and customer traffic can arrive differently across stores and departments. Logile’s Enterprise Productivity Simulator helps retailers model those scenarios before peak arrives, compare cost, service and productivity tradeoffs, and understand how changes to the plan could affect stores before decisions reach the floor.
Recent Posts
What 1,000 Shoppers and 200 Retail Leaders Told Logile About Fresh Operations
2026-10-08
Fresh shapes where shoppers buy groceries and which stores they trust. Two Logile studies reveal a gap between shopper expectations and retailers’ visibility into fresh operations—and where grocers can focus their efforts.
Read More
Holiday Is the Ultimate Test of Your Labor Plan
2026-10-05
Holiday puts every labor planning assumption to the test. See how retailers can model demand, staffing, service, and cost scenarios before stores have to.
Read More
Fresh Operations Industry Survey
2026-10-01
Logile’s survey of 200 retail leaders reveals fresh operations challenges across visibility, shrink, labor planning, AI and technology.
Read More